Overview
Metric Overview
This is a screen where you can view the current key metrics of all brokers at a glance, consisting of several detailed categories.
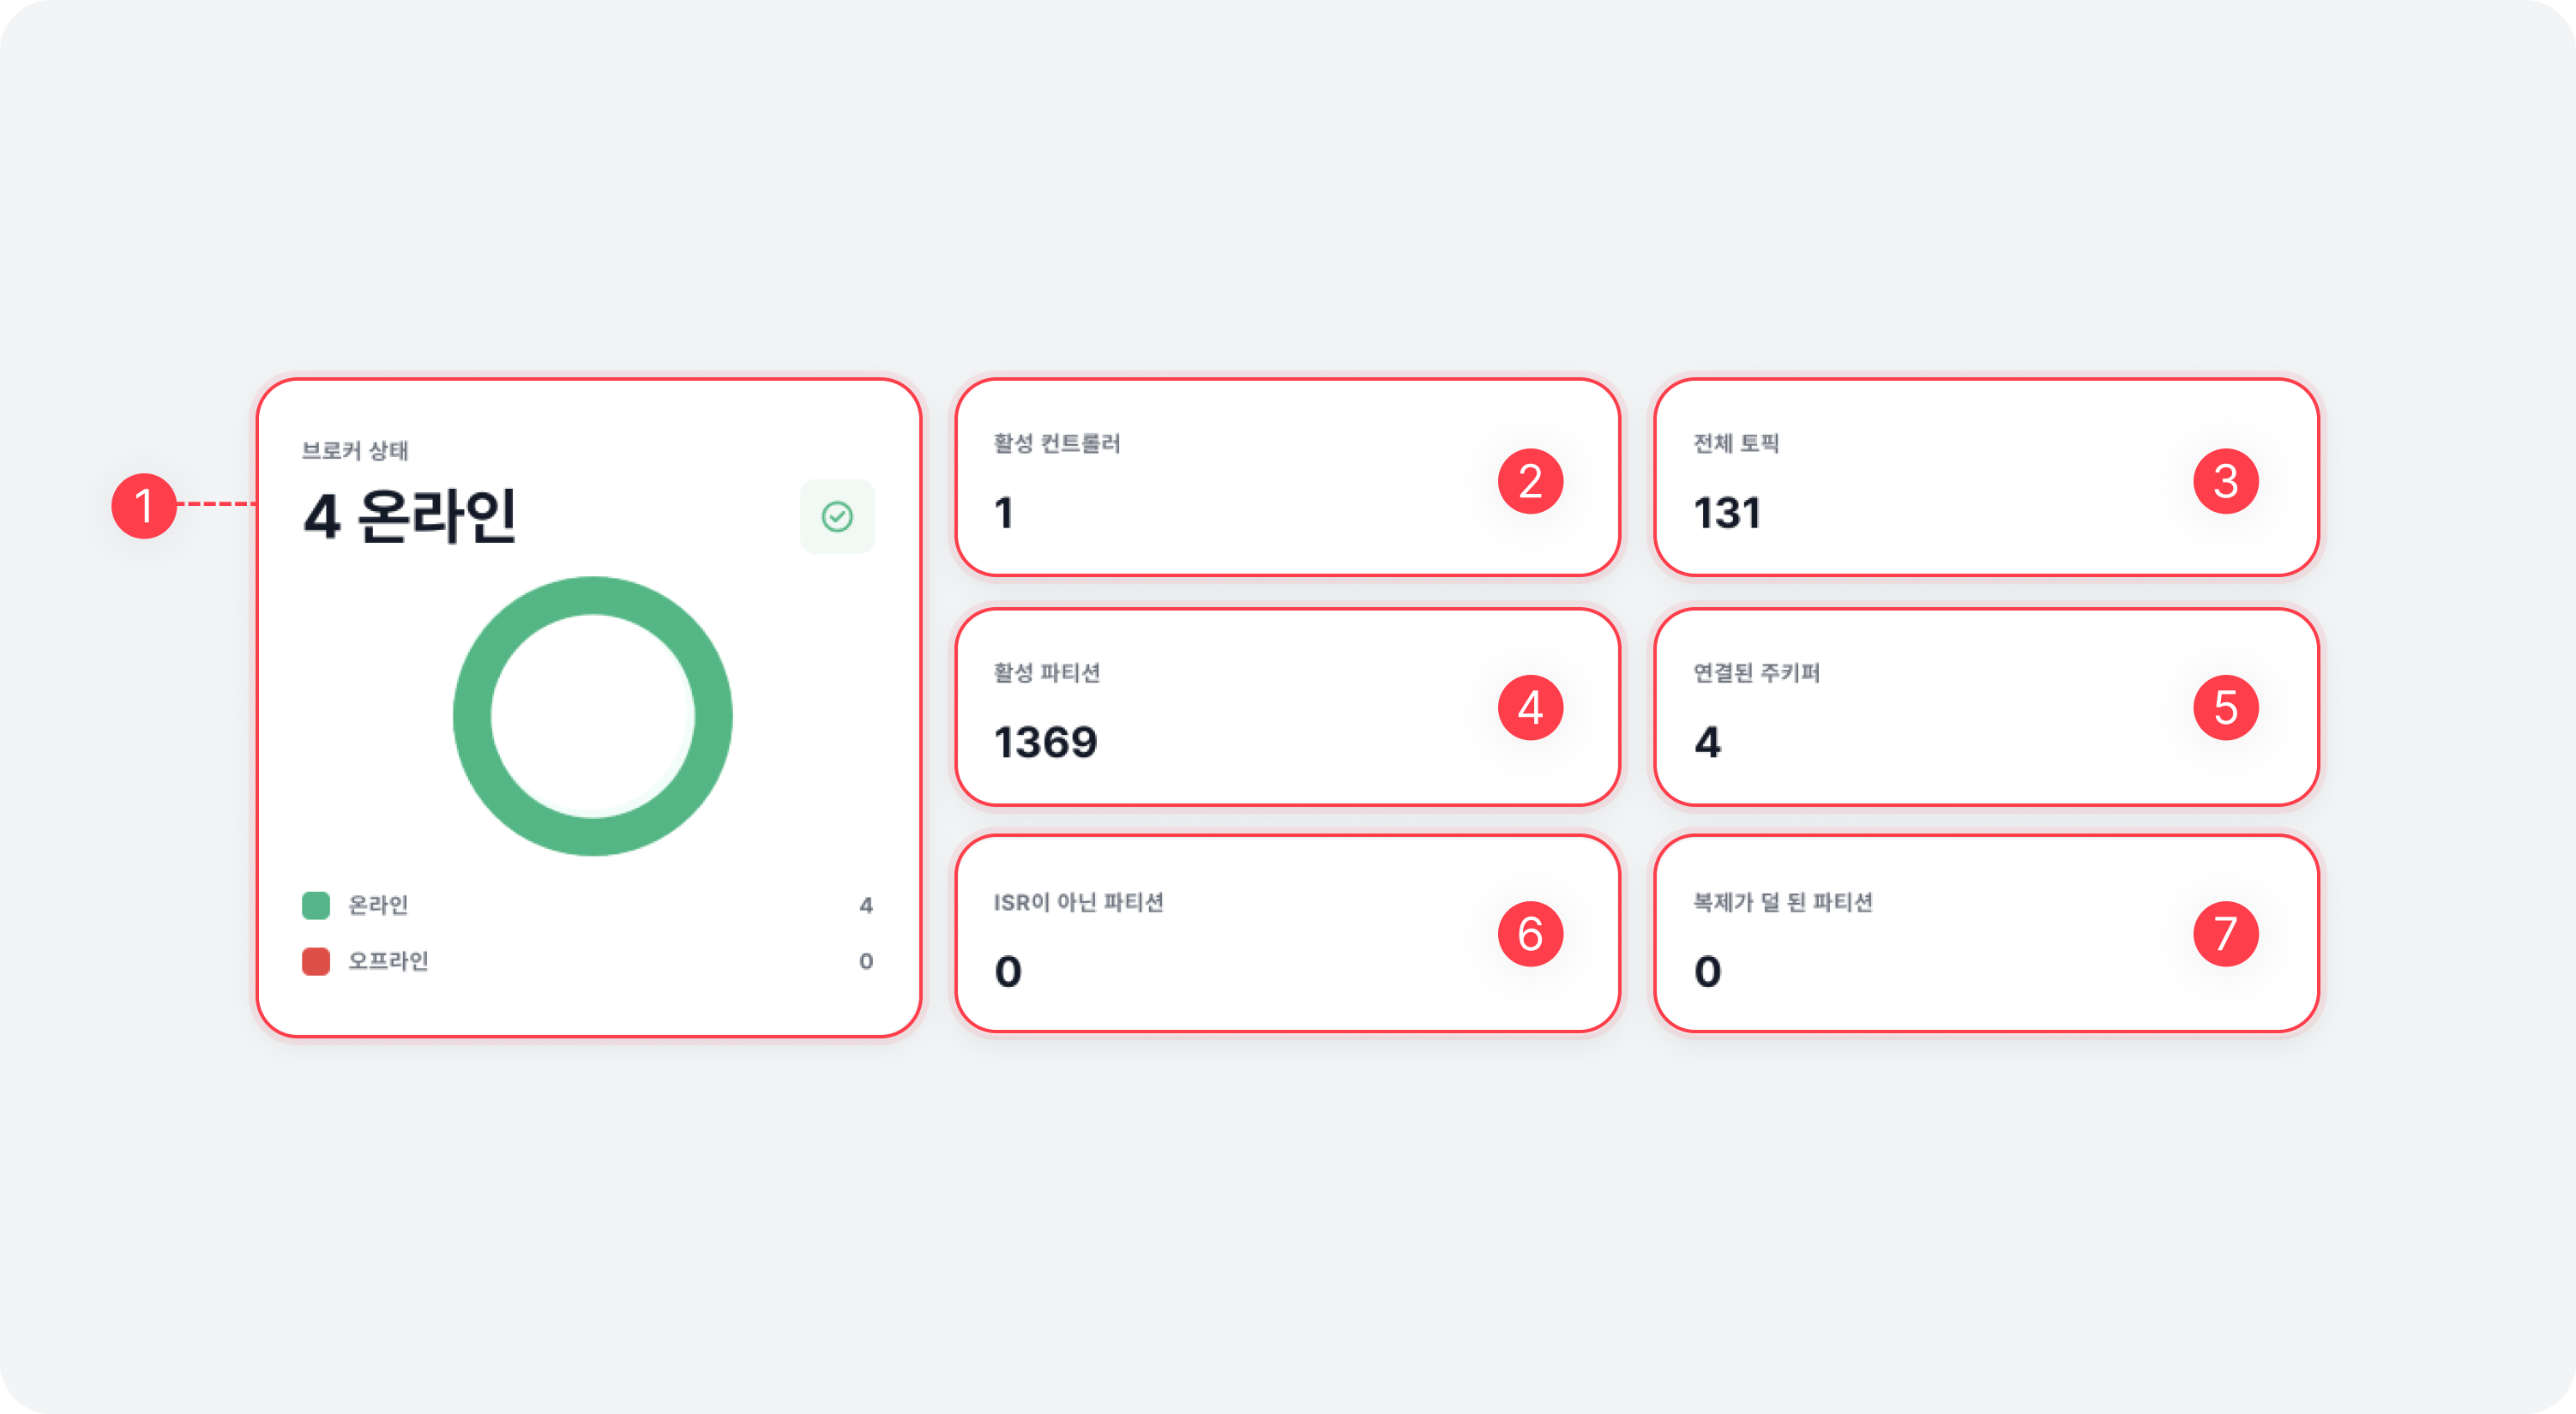
Overall Broker Status
| Item | Description |
|---|---|
| ⓵ Broker health | Displays the number of online/offline brokers |
| ⓶ Active controllers | Displays the number of active controllers (error, if this value is not 1) |
| ⓷ Topics | Total number of topics |
| ⓸ Active partition | Number of active partitions |
| ⓹ Connected ZooKeeper | Displays the ZooKeeper connection status of online brokers (error, if the number of online brokers and the number of connections do not match) |
| ⓺ Under ISR | Number of topic partitions that do not meet the minISR setting (may temporarily be non-zero) |
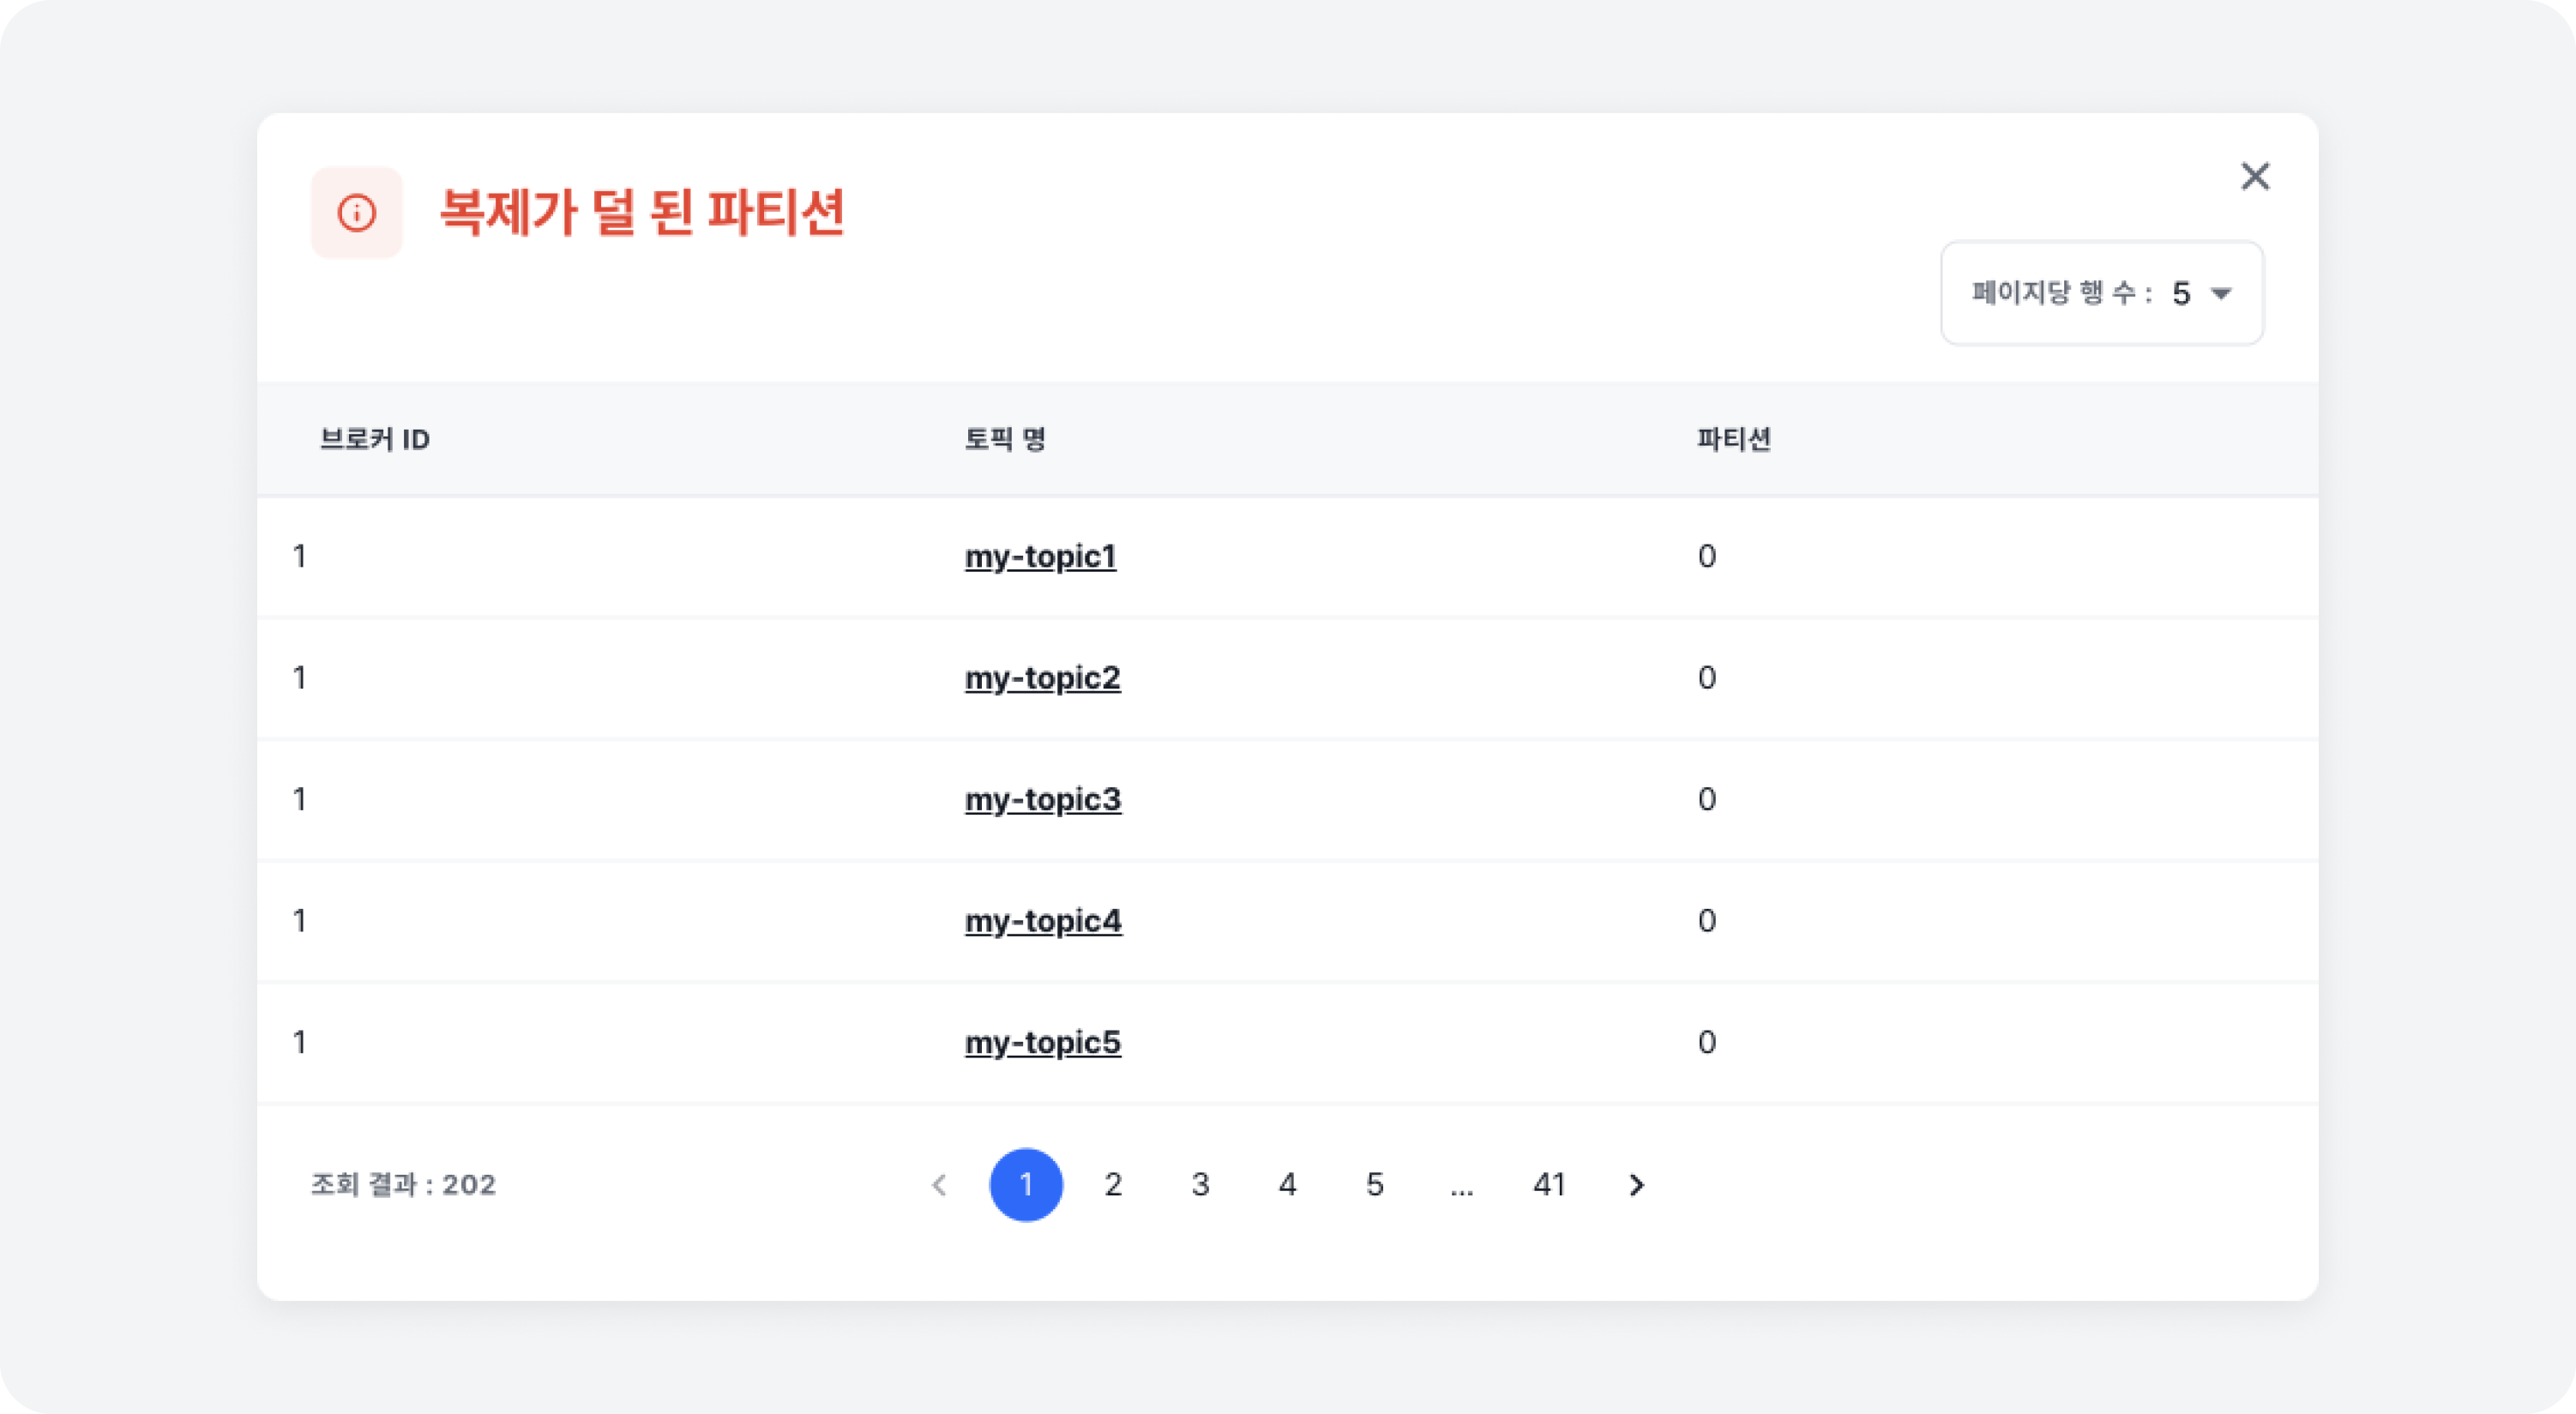
| ⓻ Under replicated partition | Number of topic partitions that do not meet the replication factor (0 value indicates normal status) |
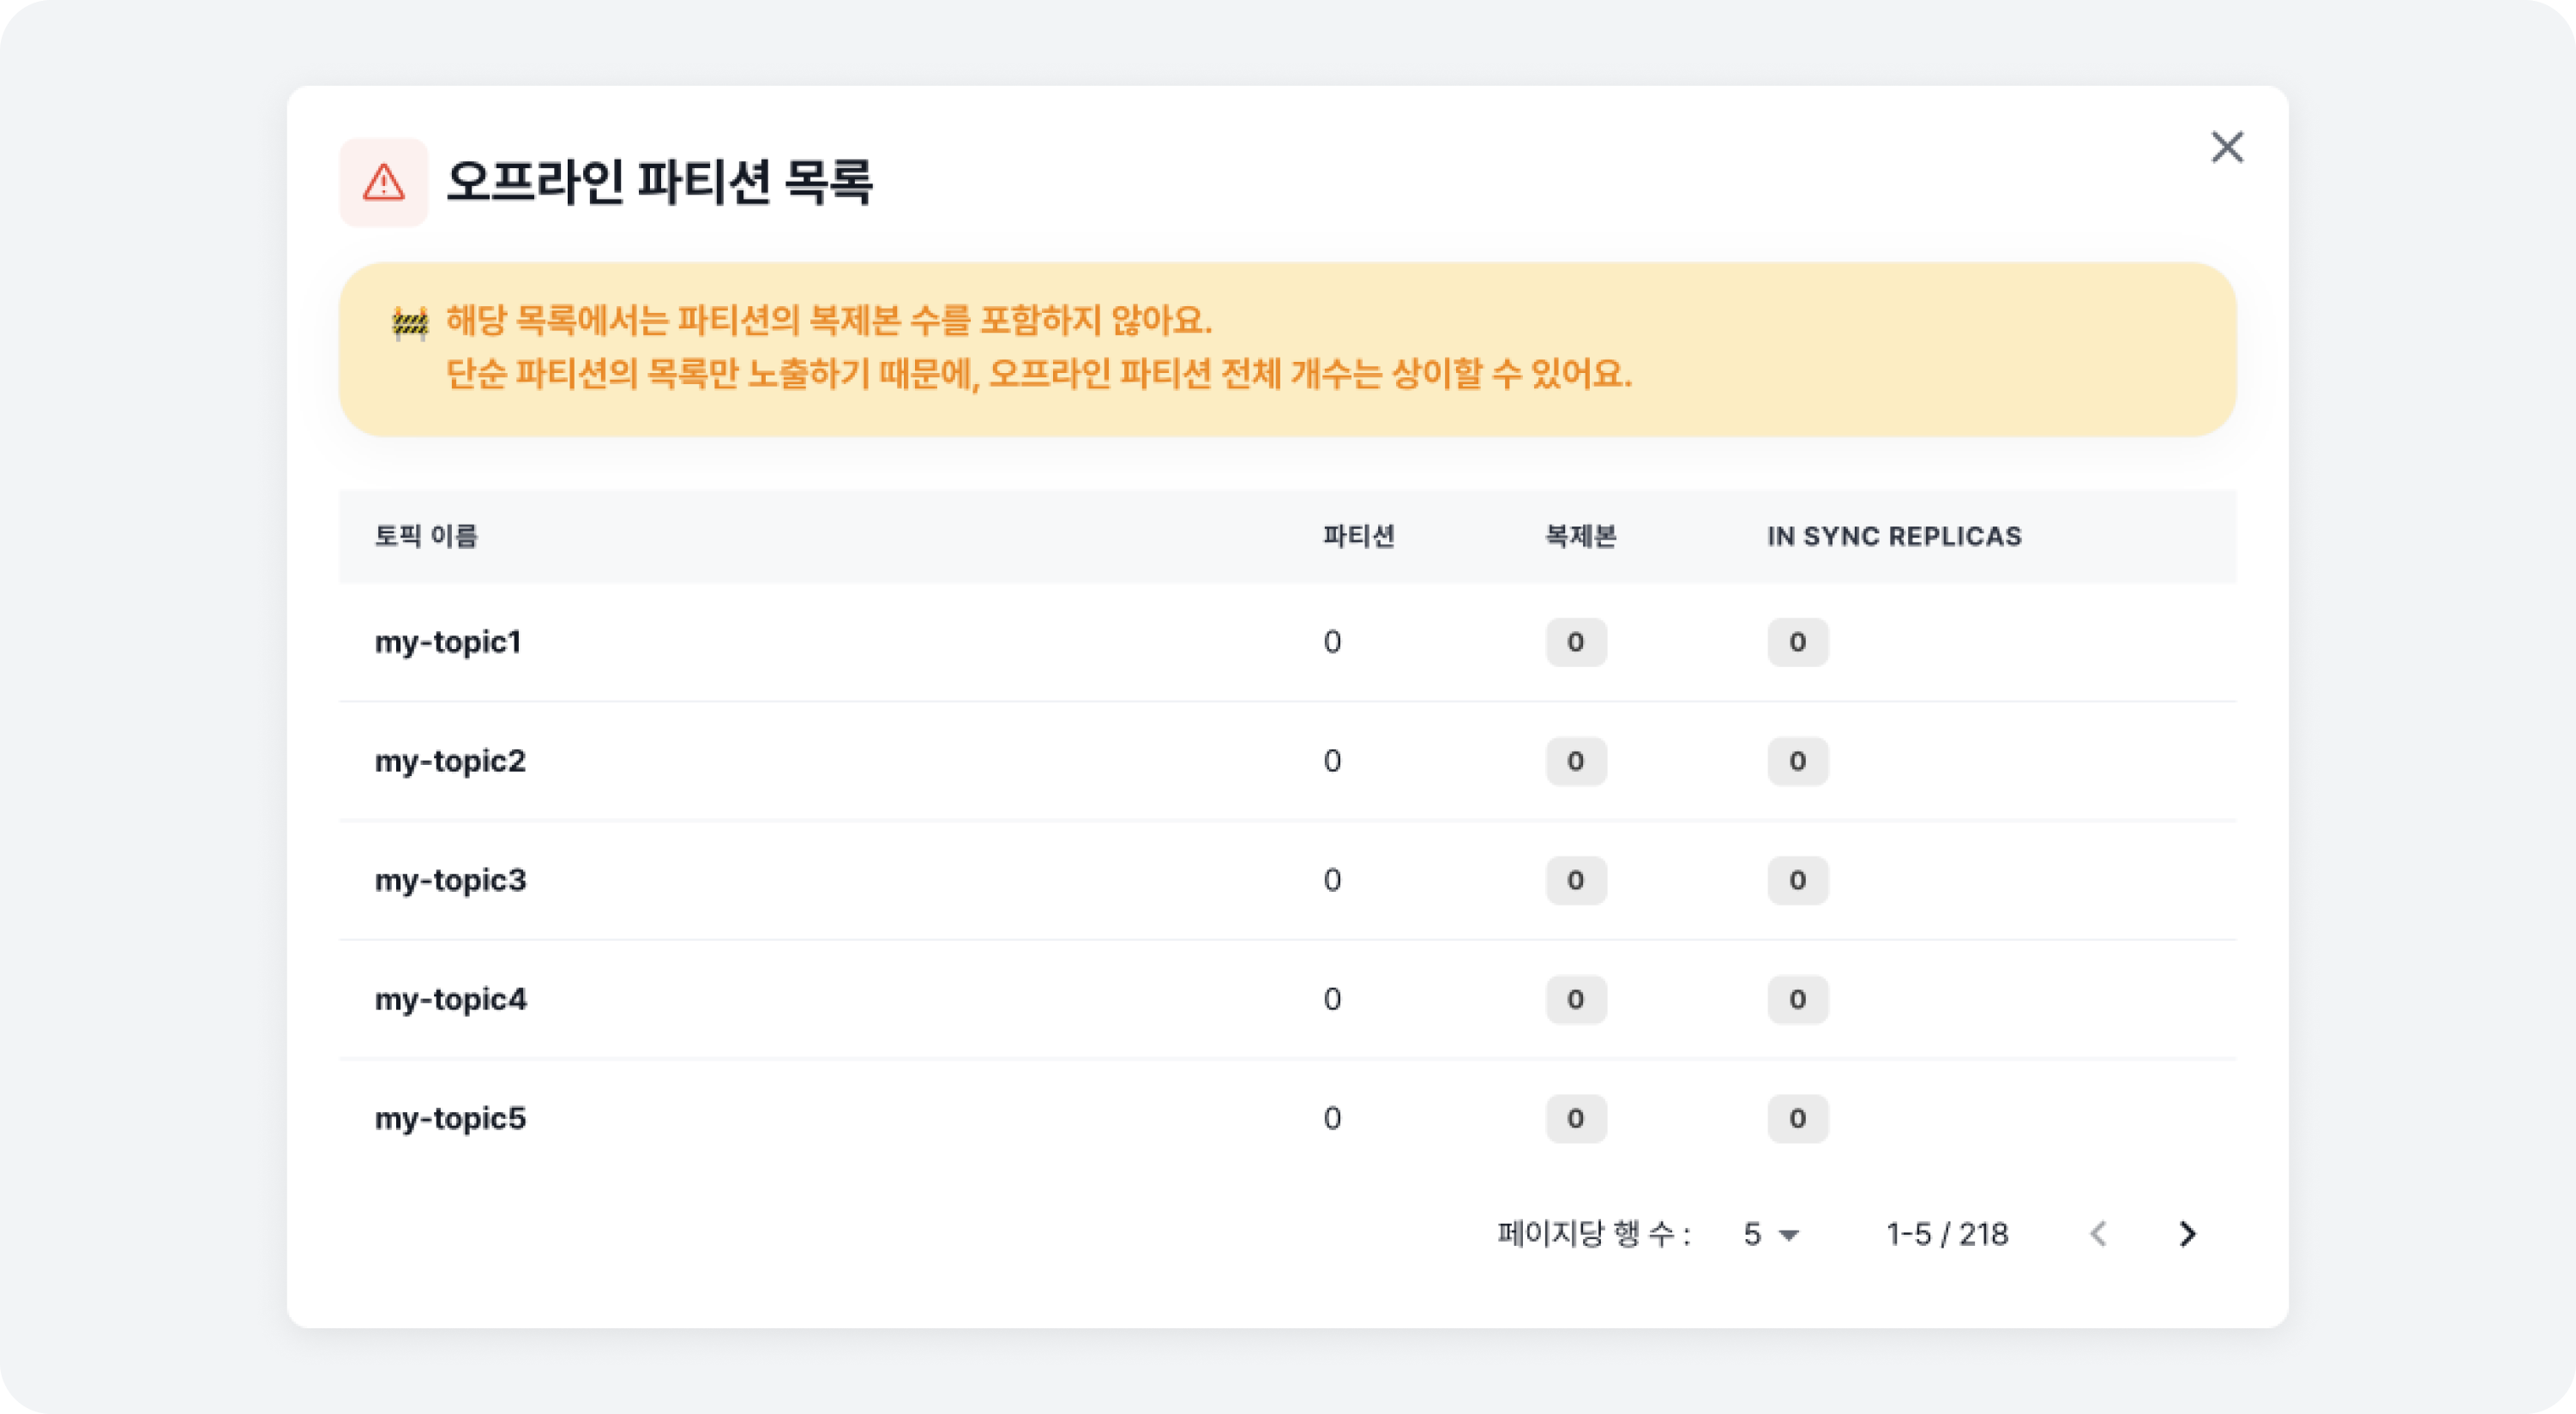
If there are inactive partitions due to a broker being down, ⓸ Active partition changes to ⓸ Active/Inactive Partition, showing both the active and inactive partitions. Clicking the number of inactive partitions will display a list of topic partitions (including the location of replicas and ISR partitions) that are currently inactive.
If there are partitions that do not meet the ISR, a [Warning Sign] will appear, and clicking on the sign will display a list of topic partitions that currently do not meet the min ISR.
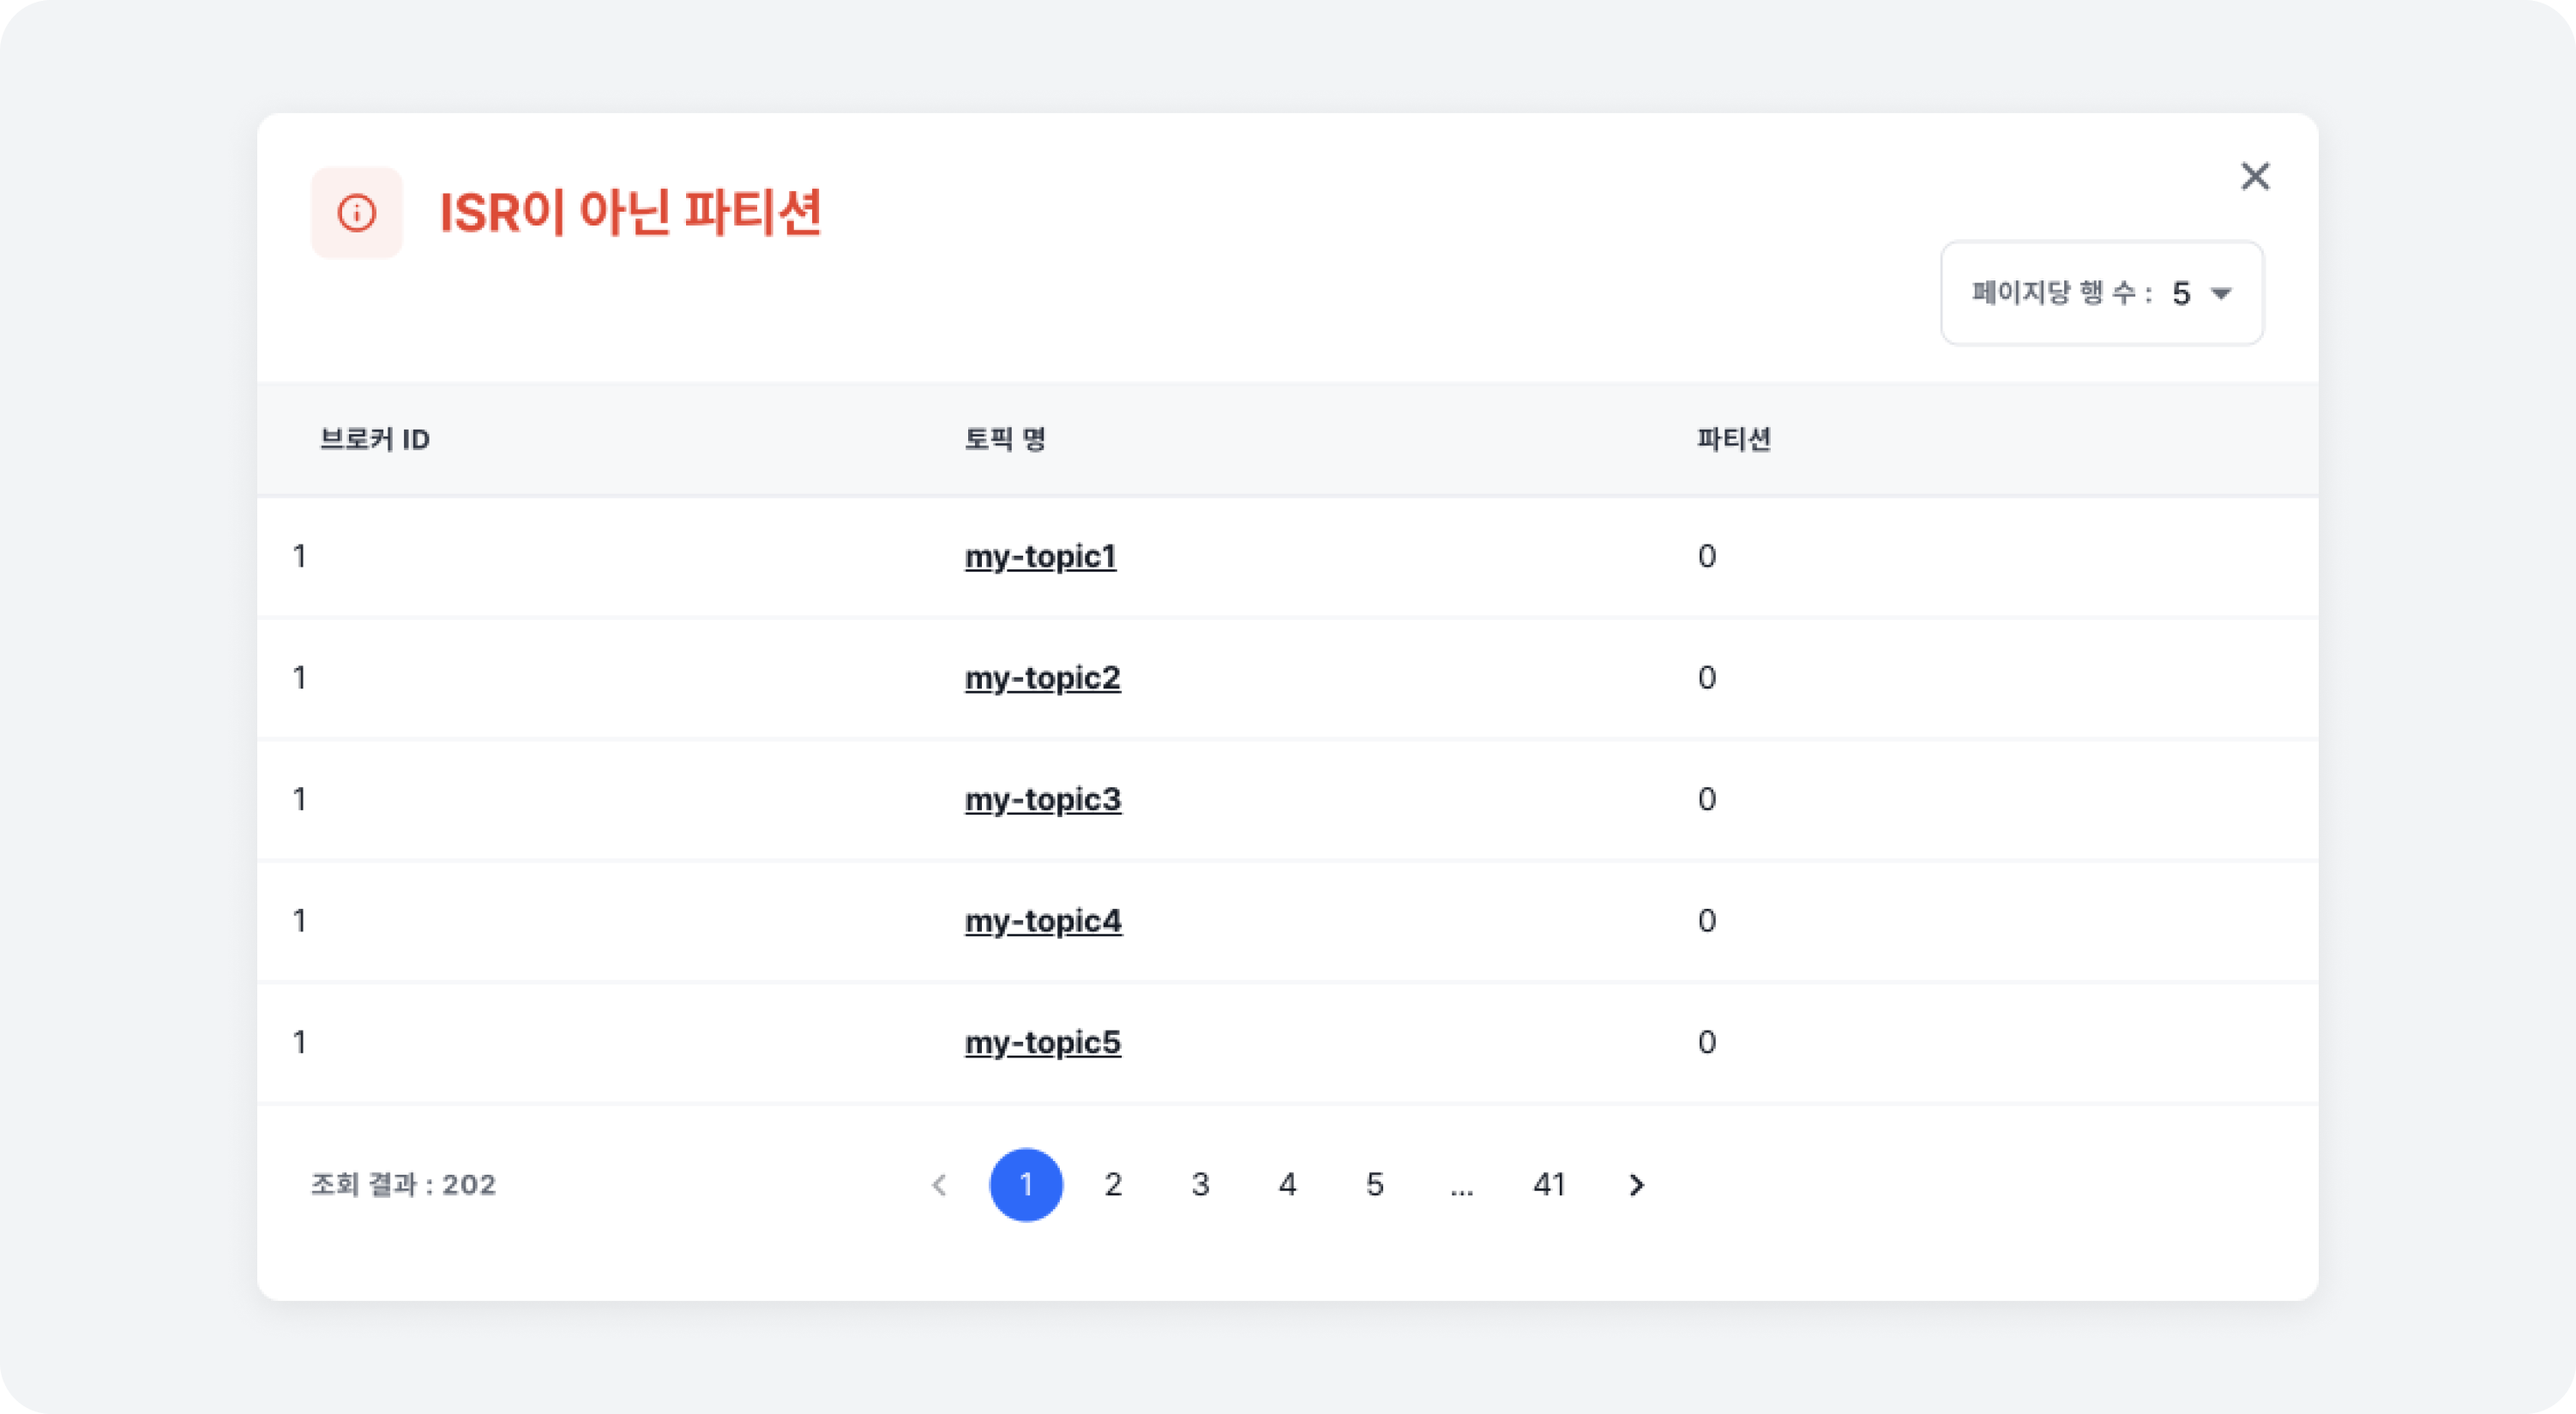
For more details on min ISR, refer to the Topic Settings document.
If there are under-replicated partitions, a [Warning Sign] will appear, and clicking on the sign will display a list of topic partitions that currently do not meet the replication factor.
For more details on replication factor, refer to the Topic Settings document.
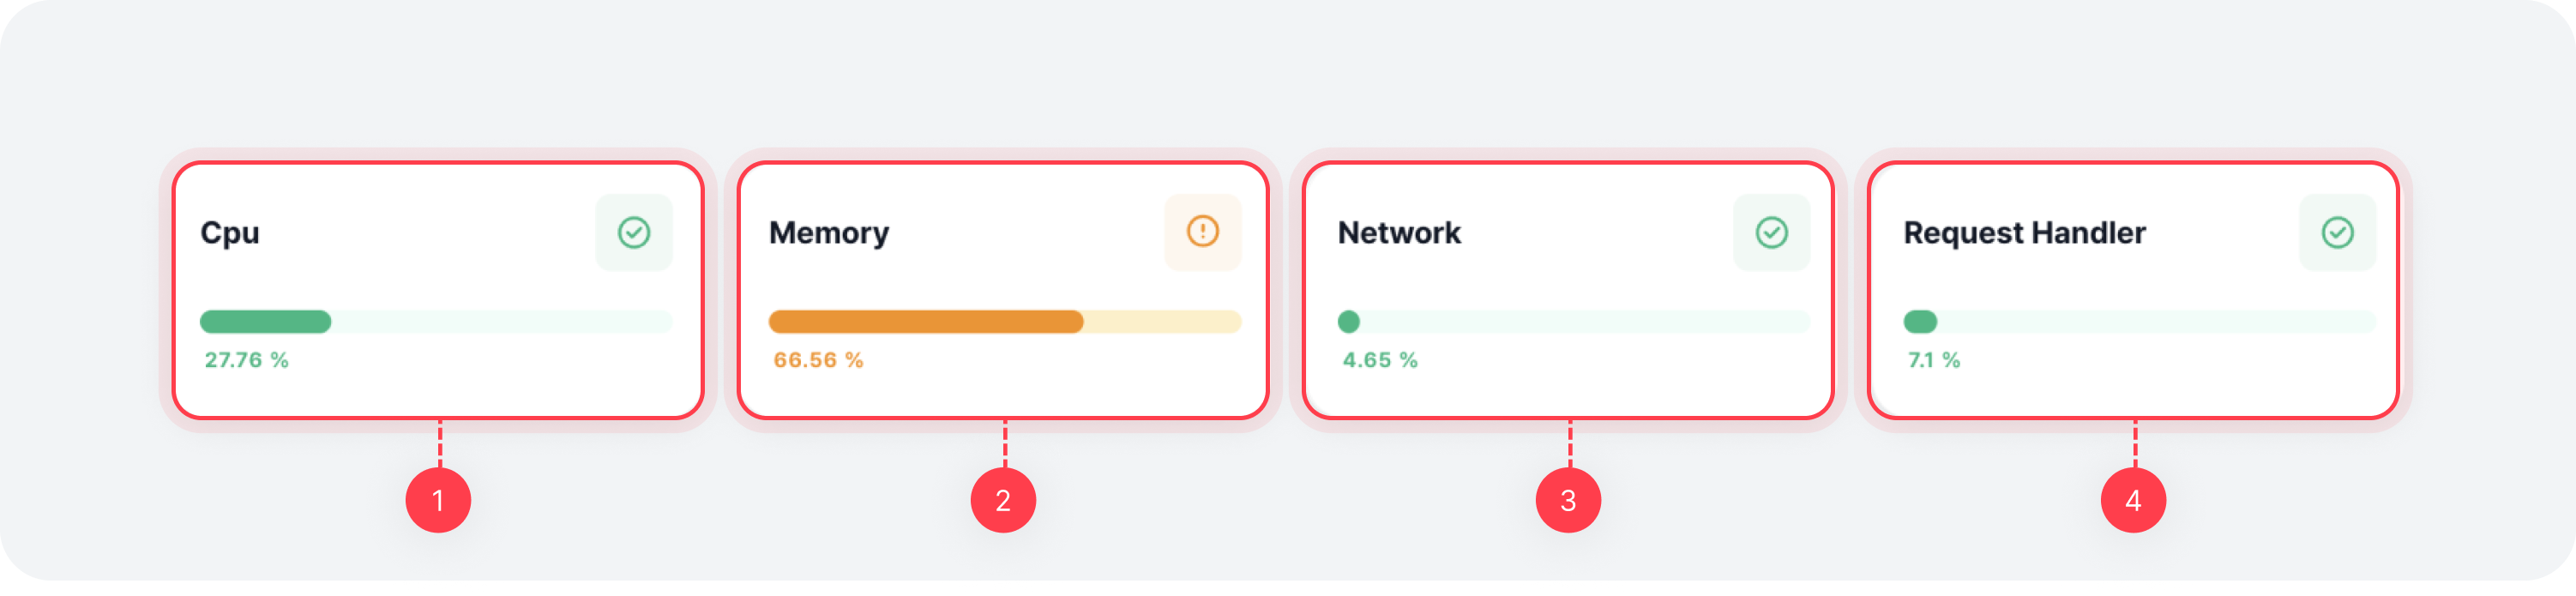
Average Node Resource Usage Rate
| Item | Description |
|---|---|
| ⓵ Average CPU Usage Rate | The average CPU usage rate across all brokers |
| ⓶ Average Memory Usage Rate | The average memory usage rate across all brokers |
| ⓷ Average Network Usage Rate | The average network usage rate across all brokers |
| ⓸ Average Request Handler Usage Rate | The average usage rate of request handlers across all brokers |
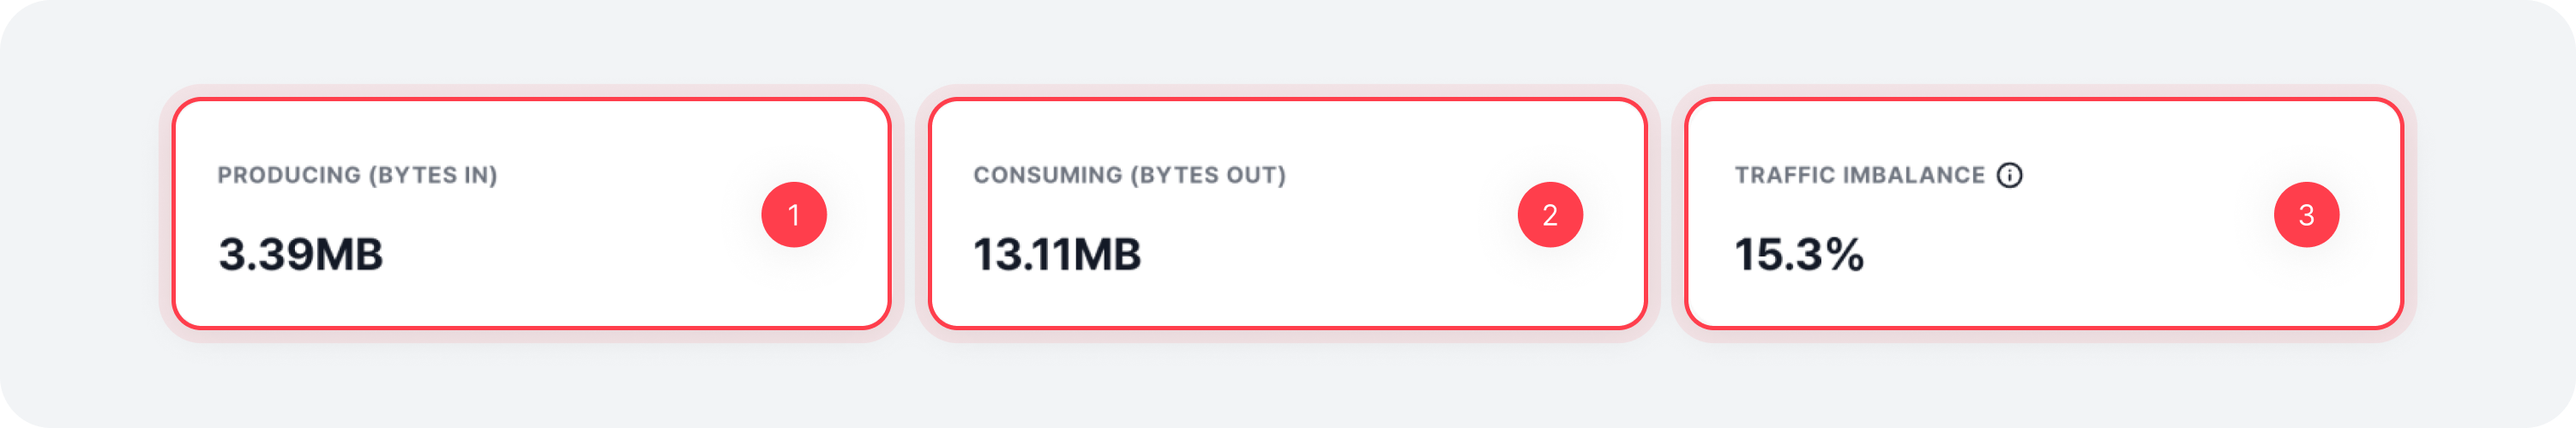
Message Producing / Consuming / Traffic Imbalance
| Item | Description |
|---|---|
| ⓵ Producing (Bytes in) | The total incoming message rate per second for the entire cluster (in bytes) |
| ⓶ Consuming (Bytes out) | The total outgoing message rate per second for the entire cluster (in bytes) (including Consumer and Follower) |
| ⓷ Traffic imbalance | The traffic ratio of leader partitions per broker |
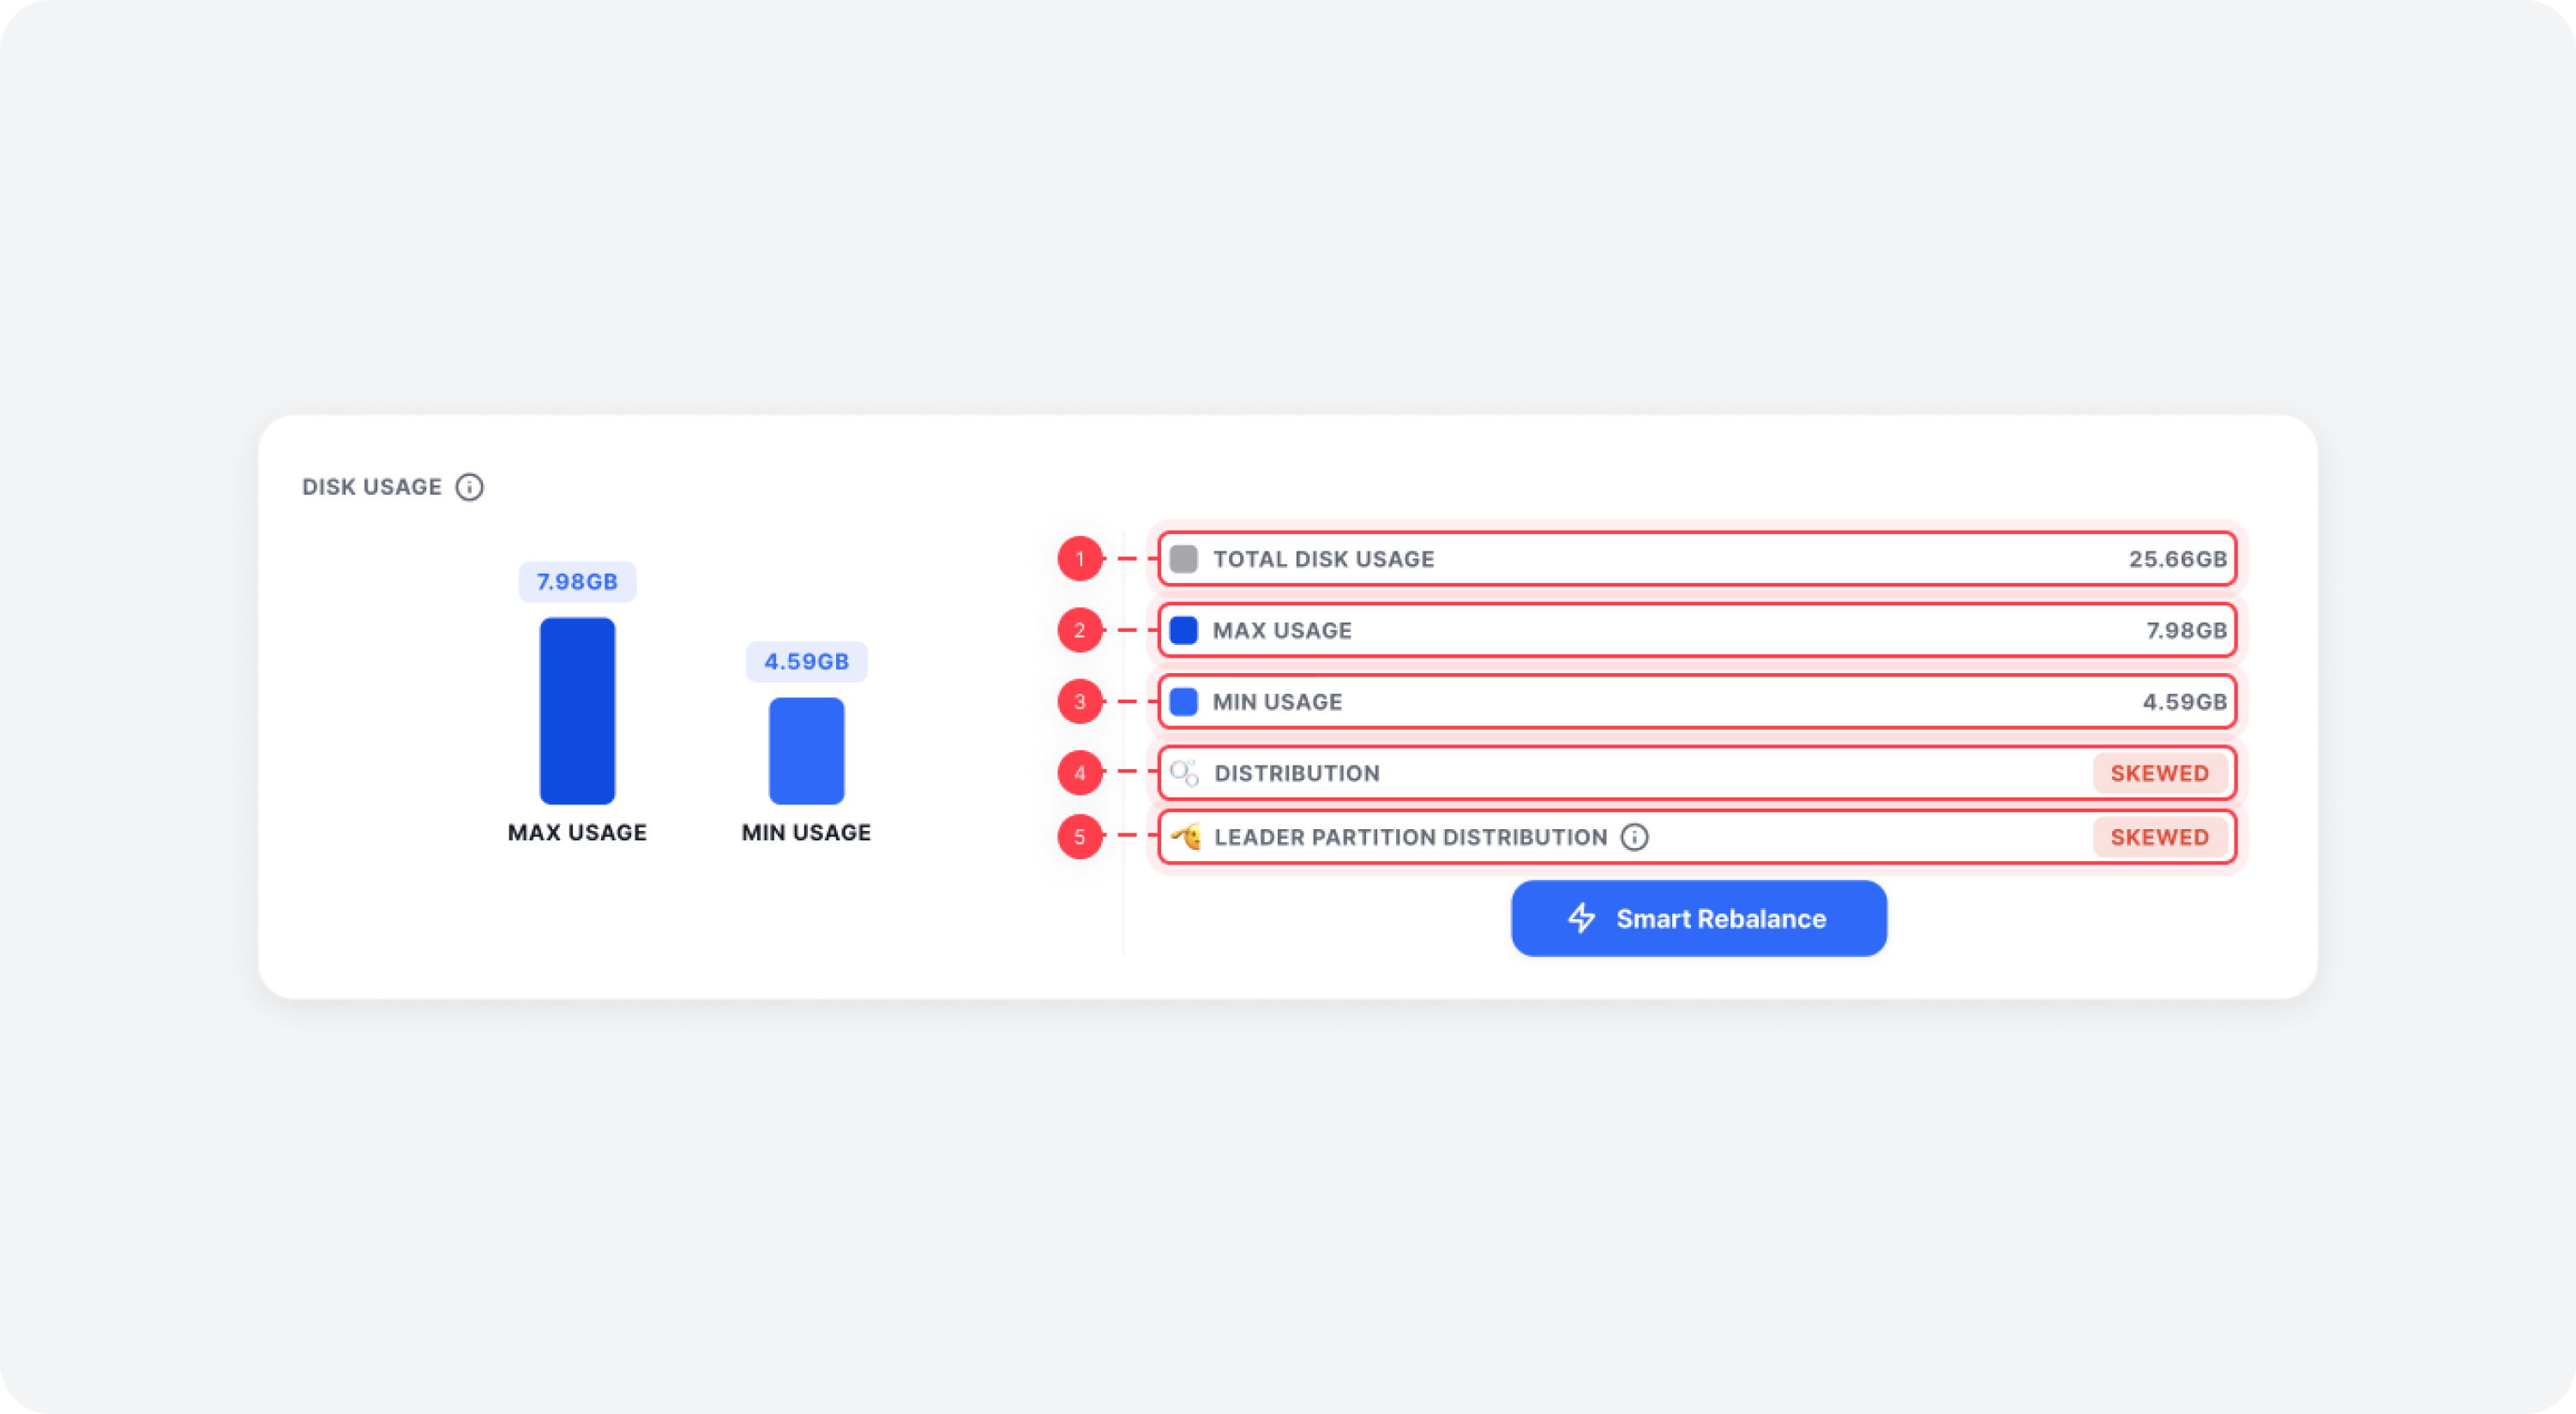
Disk Usage
| Item | Description |
|---|---|
| ⓵ Total disk usage | The total disk usage for topic partitions in all clusters |
| ⓶ Max usage | The highest total disk usage for topic partitions per broker |
| ⓷ Min usage | The lowest total disk usage for topic partitions per broker |
| ⓸ Distribution | Skewed if the topic partition disk usage difference between brokers exceeds 10% |
| ⓹ Leader Partition Distribution | Skewed If the leader imbalance ratio (normalized value) exceeds 10% |
If disk usage is imbalanced, the [Smart Rebalance] button will appear, allowing you to balance out the usage through a rebalancing operation.
For more details, refer to the Smart Rebalance document.
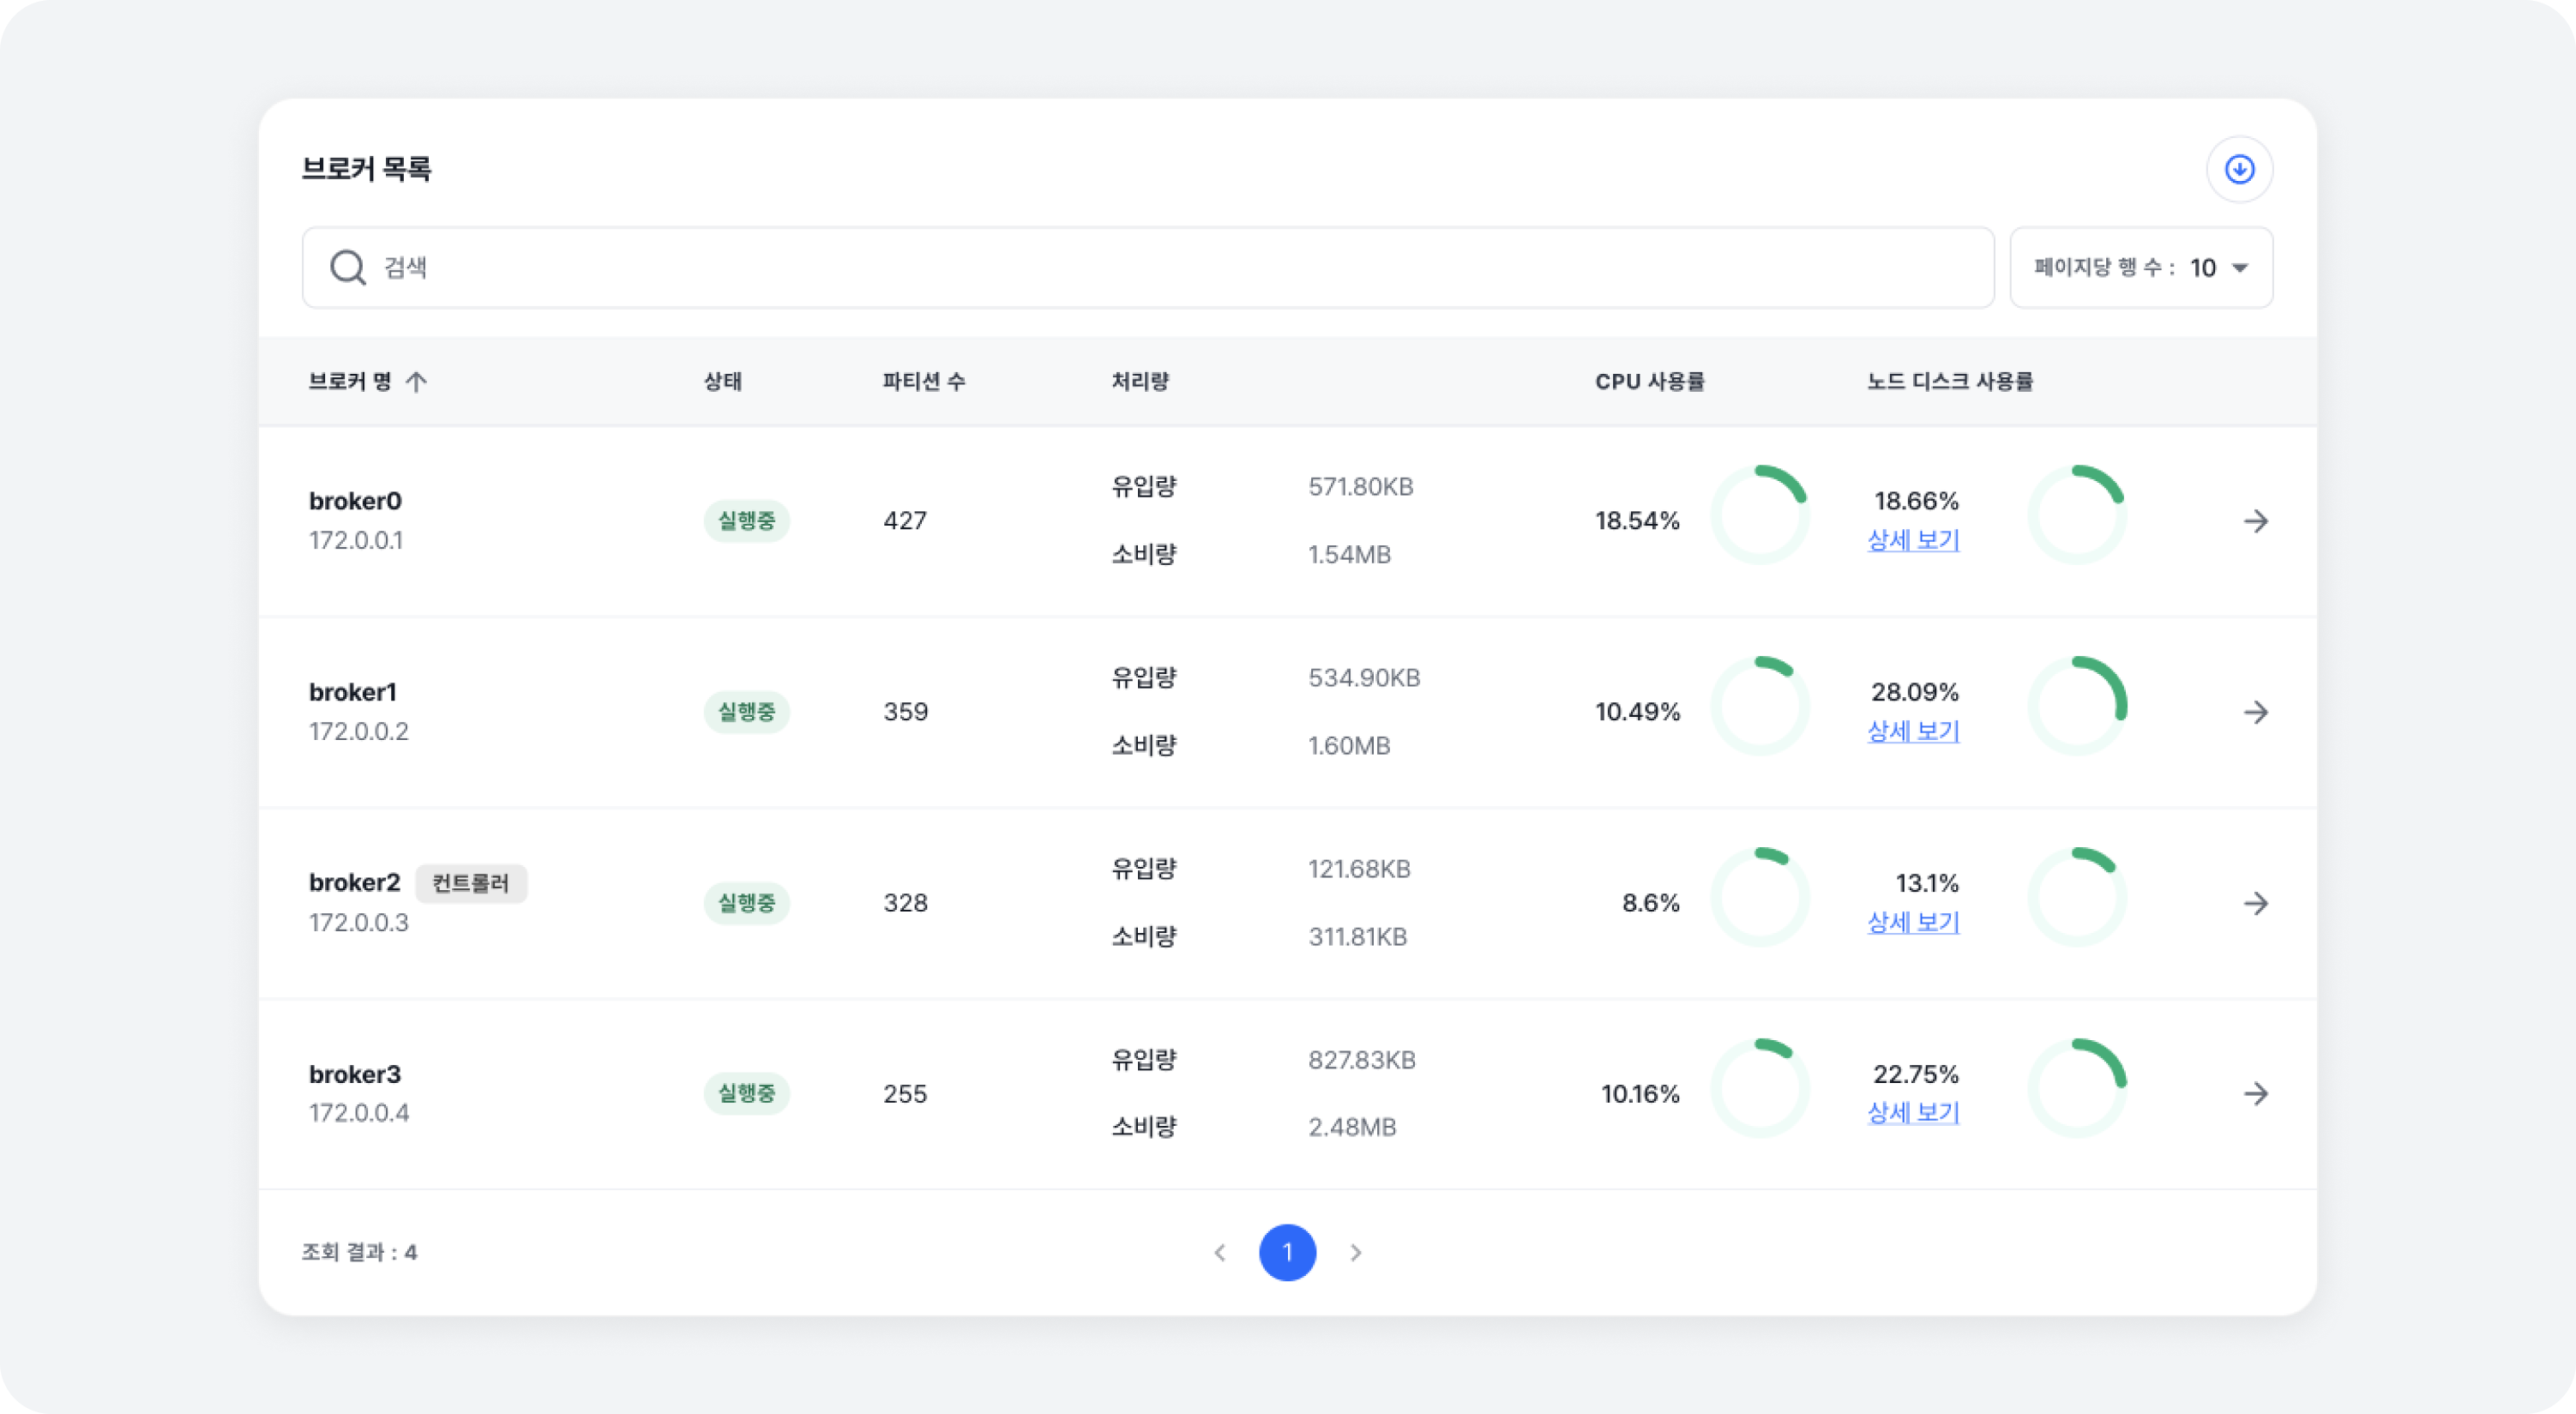
Broker List
At the bottom of the metric overview page, you can see a list of all brokers. By clicking on a [Broker Name] in the list, you can navigate to the Broker Metrics details page.