Error Log Tracer
You can view error logs within Felice to identify the exact reasons for their occurrences.
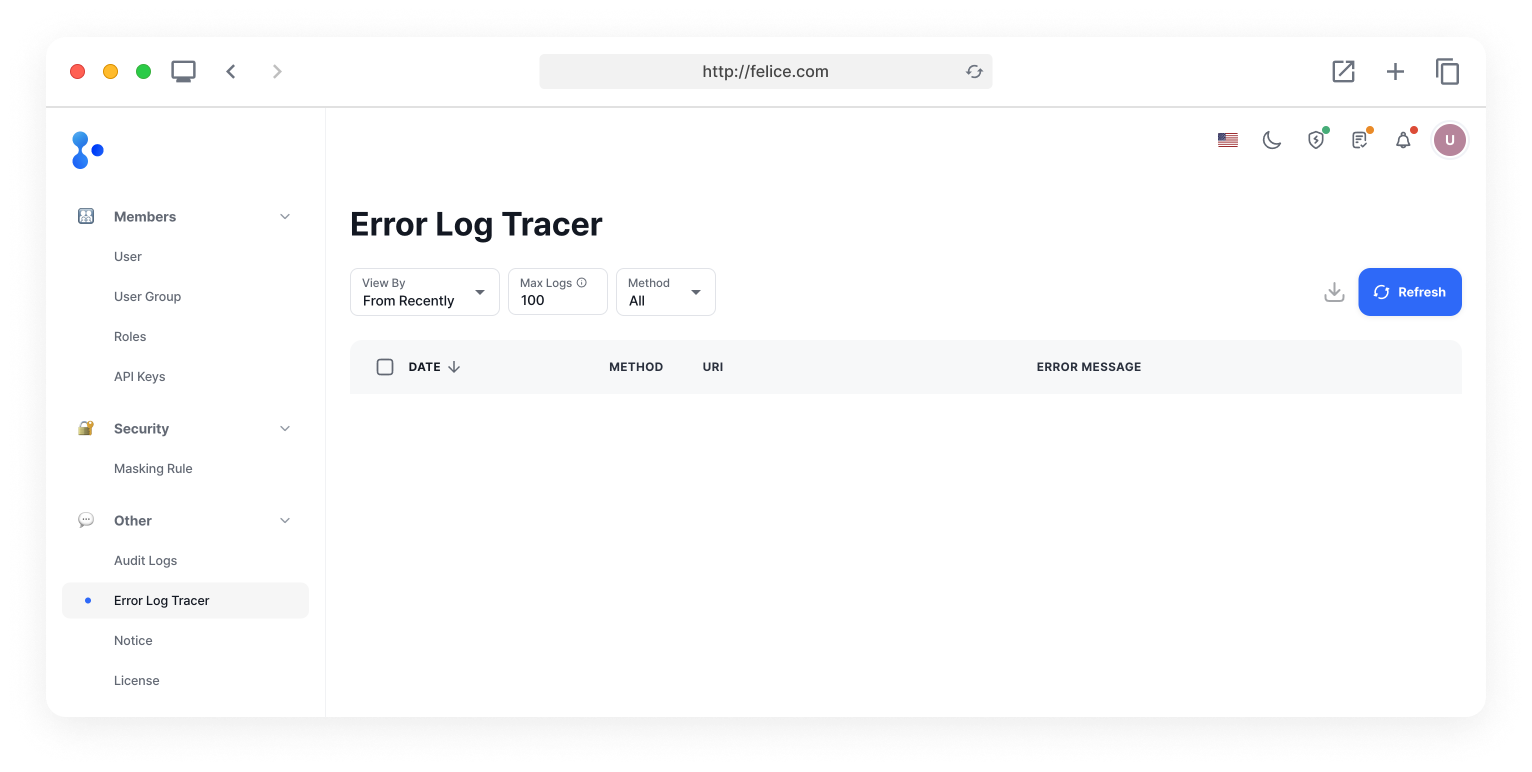
Click on the [Shield Icon > Error Log Tracer] button in the upper right corner to navigate to the Error Log Tracer page.
Felice's audit logs currently do not record API Request errors separately unless they are login failures. They only record logs when actual data changes occur and succeed (modification, deletion, creation). On the other hand, error log tracer allows you to see why errors occurred not only during modifications, deletions, and creations but also while viewing.
Error Log Filter
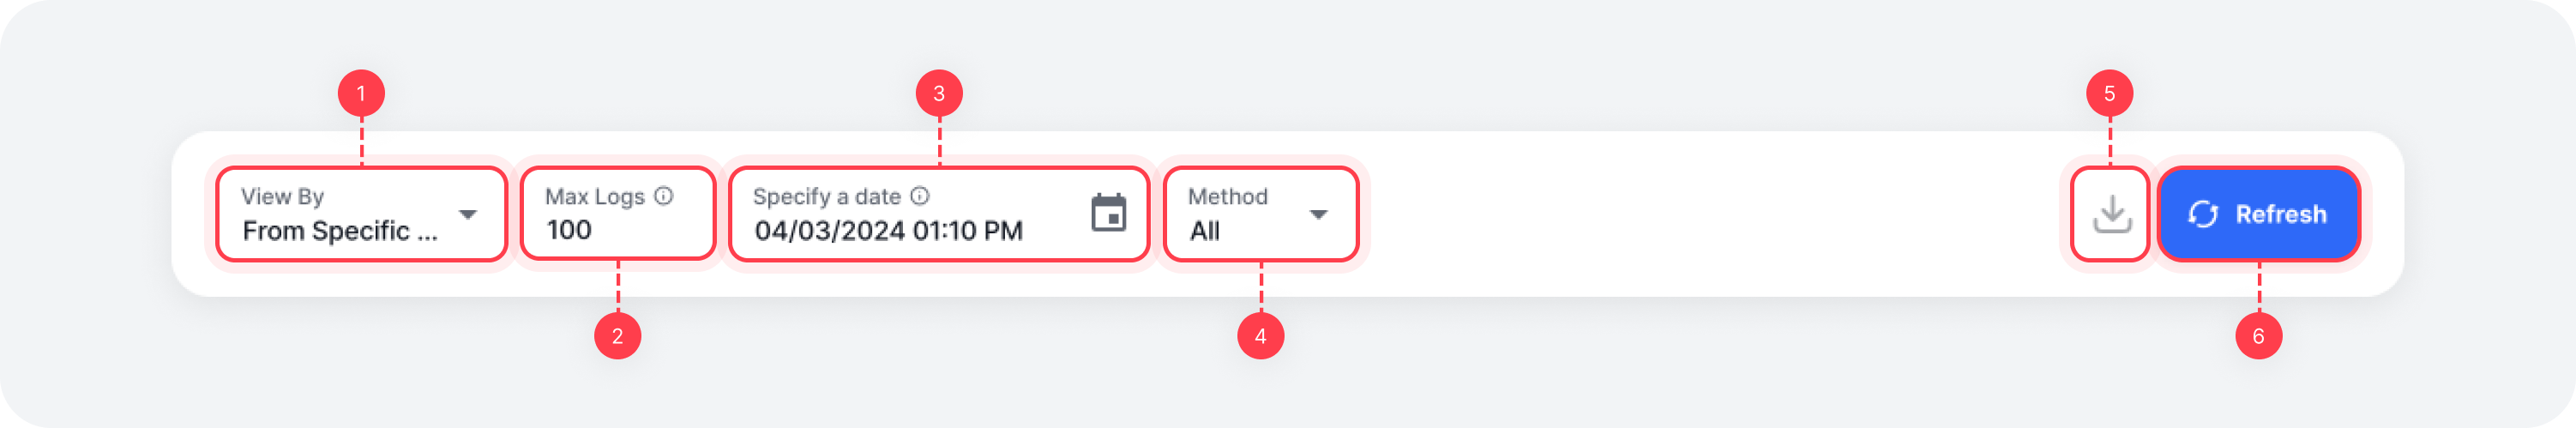
You can filter error logs using the filter at the top with your desired input. After entering the information you want to filter by, click the [Refresh] button to view the filtered error log list.
| Filter | Description |
|---|---|
| ⓵ View By | View by (From Recently, From Specific Date) |
| ⓶ Max Logs | Number of error logs to fetch (minimum 1, maximum 100) |
| ⓷ API Method | Method of the error log |
| ⓸ Specify a date | When to start fetching from (only displayed when From Specific Date is selected for the View By filter) |
| ⓹ Download button | Download the error log list as a JSON file |
| ⓺ Refresh button | View the filtered list of errors |
Filtering data does affect the download of error logs. For example, if you have 100 records and you select POST as the method, which results in 10 records displayed on the screen, clicking the download button will only download those 10 records.
Additionally, you can select specific error logs to download. If you want to download only a few logs, check the checkboxes on the left of each error log row to download.
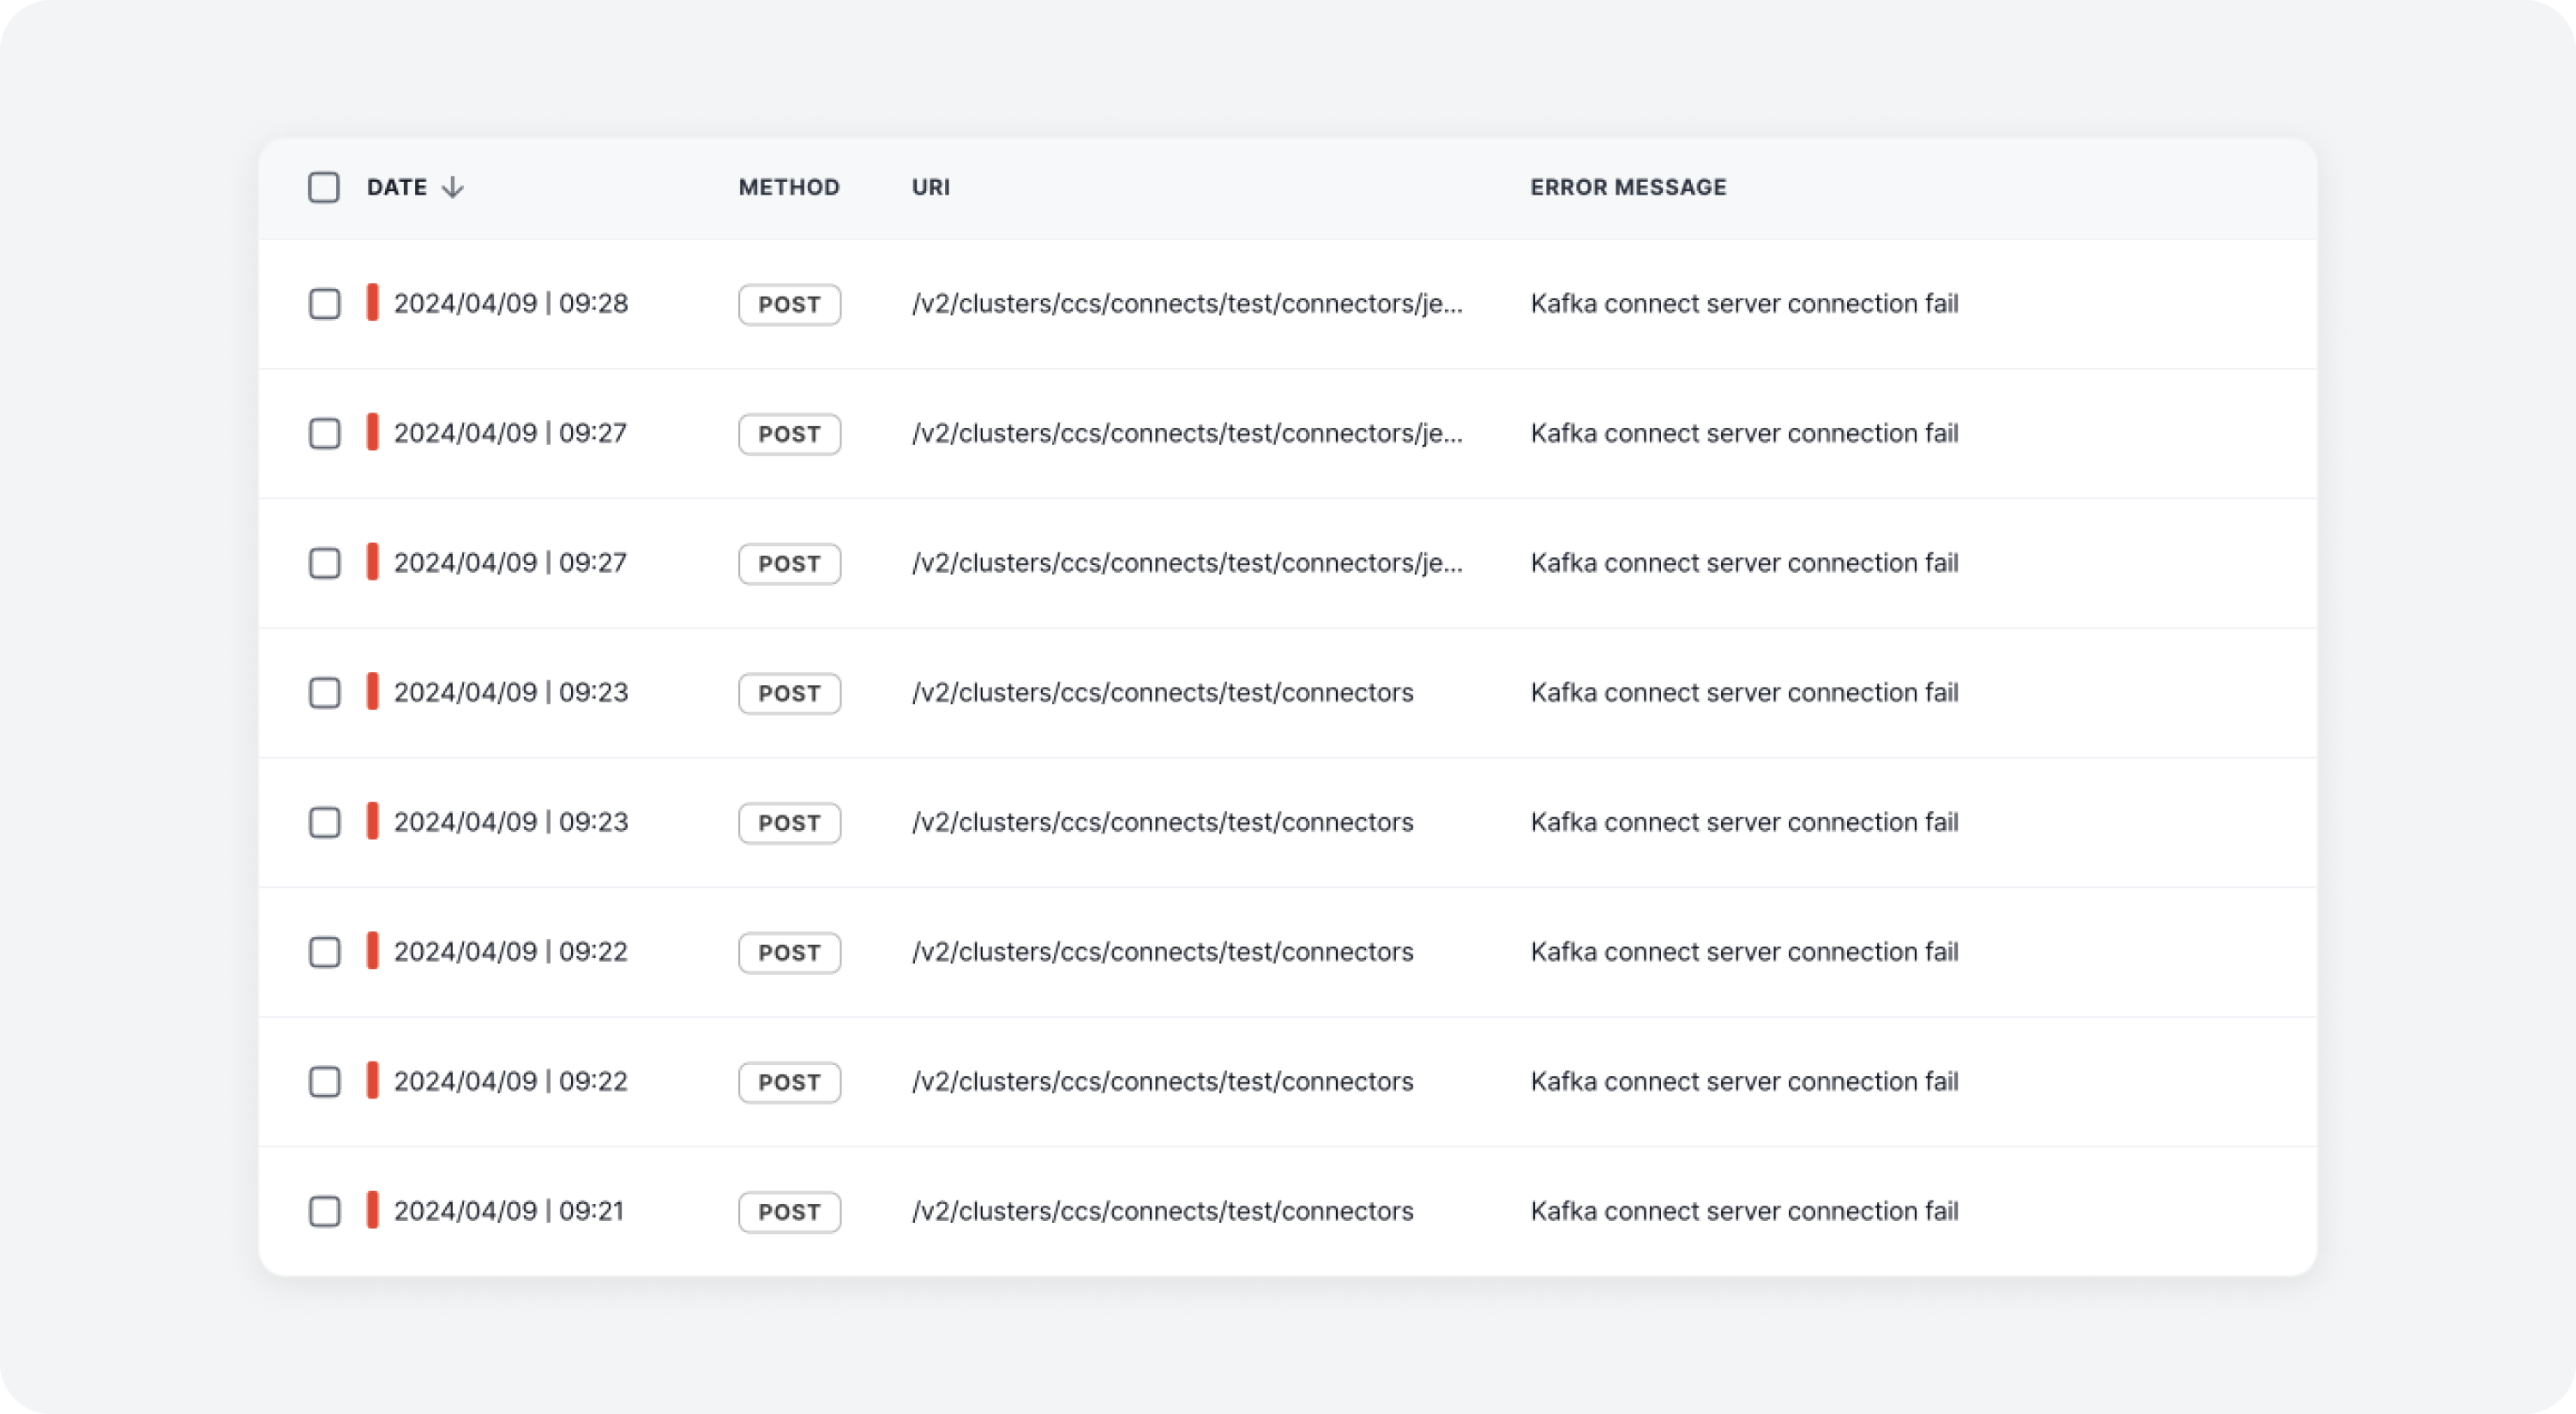
Error Log List
You can view a list of error logs that occurred in Felice.
| Column | Description |
|---|---|
| ⓵ Date | When the error occurred |
| ⓶ Method | Method of the error request (DELETE, GET, PATCH, POST, PUT) |
| ⓷ URI | URI of where the error occurred |
| ⓸ Error Message | Detailed error message (can be blank) |
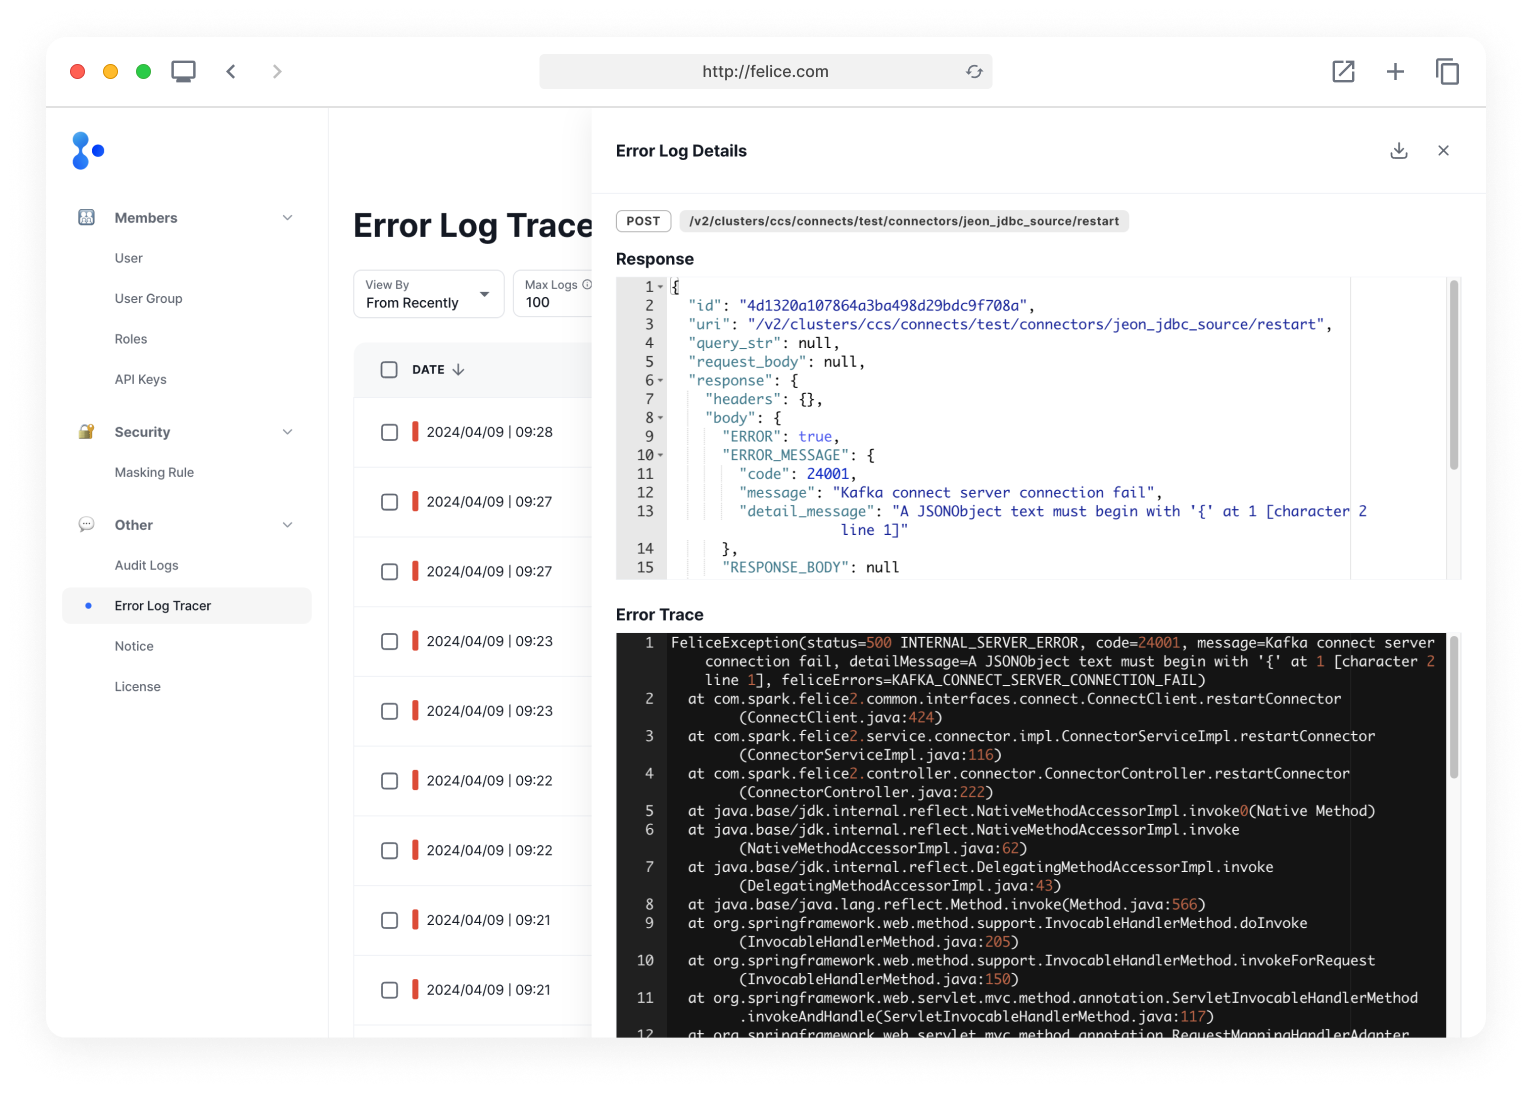
Error Log Details
By clicking on a row in the error log, you can view the details of a specific error log in a drawer or download it as a JSON file.