Broker Metrics
You can view detailed metrics for each broker and see a summary of metrics at the top of the page. The detailed metrics are mainly categorized into three tabs, Broker Metrics, Node Metrics, and Error Metrics. Broker metrics are data collected from the Kafka Broker, and node metrics are data collected from the node or pod where the Kafka Broker is running.
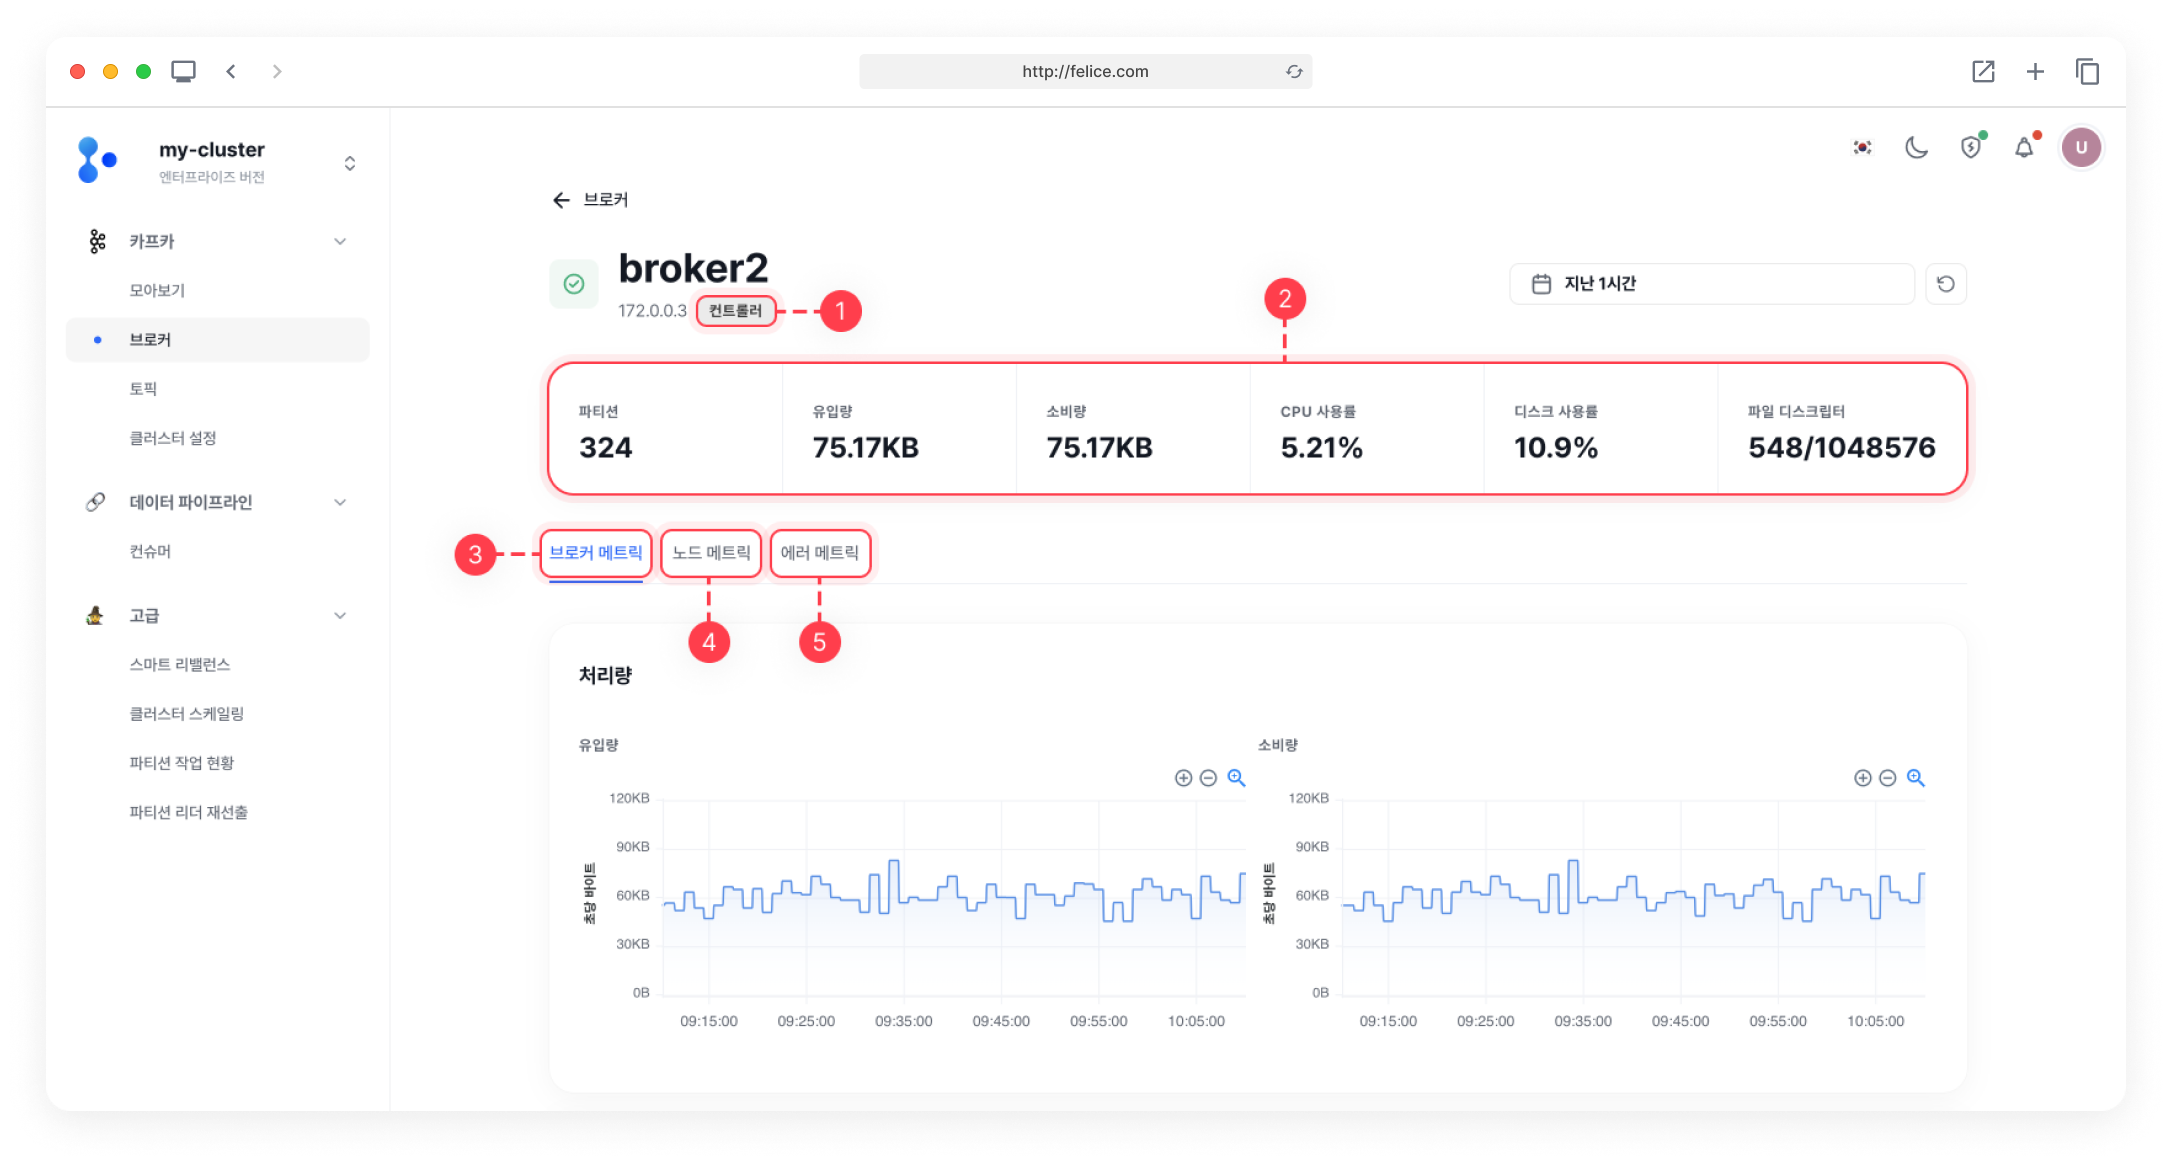
Details Information
| Item | Description |
|---|---|
| ⓵ Controller | Displayed when broker is a controller |
| ⓶ Metrics Summary | Broker metrics summary information |
| ⓷ Broker Metrics | Data collected from Kafka Brokers |
| ⓸ Node Metrics | Data collected from the node or pod where the Kafka Broker is running |
| ⓹ Error Metrics | Error Metrics occurred in Kafka Brokers |
| Item | Description |
|---|---|
| ⓵ Partitions | Number of topic partitions stored in the specific broker |
| ⓶ Producing | Message producing per second of the specific broker (in bytes) |
| ⓷ Consuming | Message consuming per second of the specific broker (in bytes) (including Consumer and Follower) |
| ⓸ CPU load | CPU usage rate of the specific broker |
| ⓹ Disk usage | Average disk usage of the specific broker (average disk usage for each major mount) |
| ⓺ File descriptor | Number of open files and maximum number of open files of the specific broker |
Broker Metrics
You can view the data collected directly from the Kafka Broker in a time series graph.
Throughput
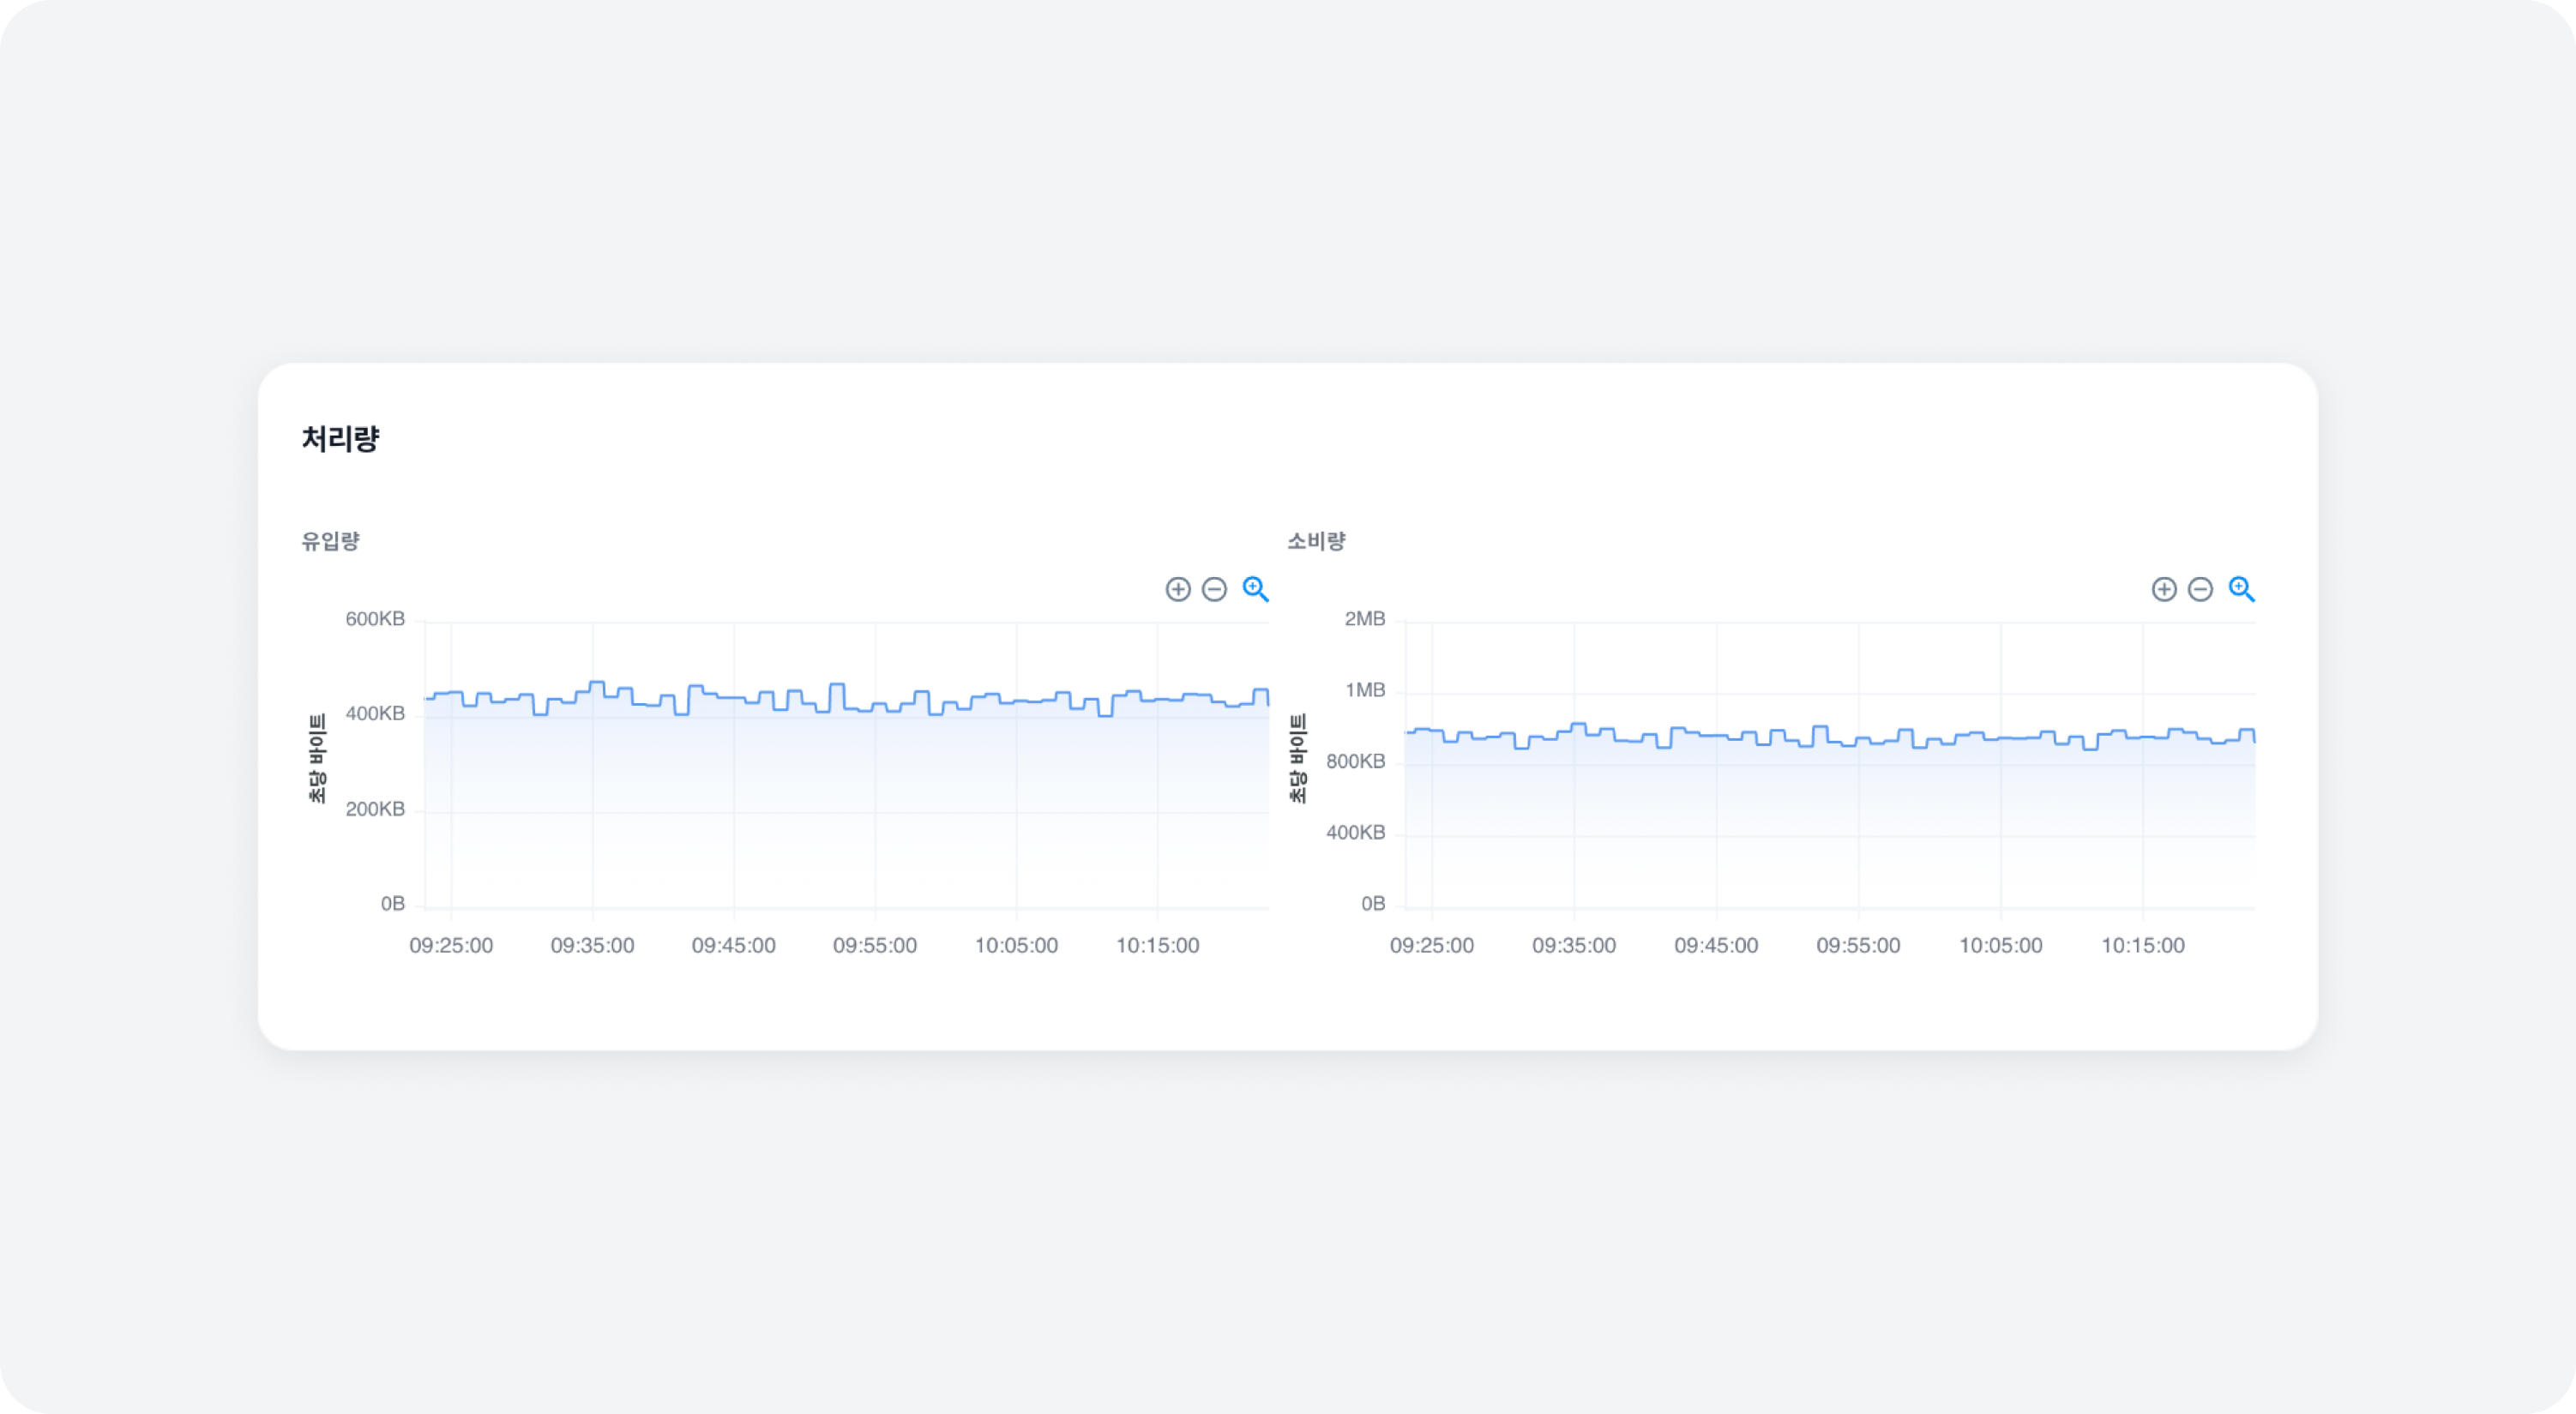
- Production
History of messages produced in bytes per second of the specific broker - Consumption
History of messages consumed in bytes per second of the specific broker. Includes Consumer and Follower.
Latency
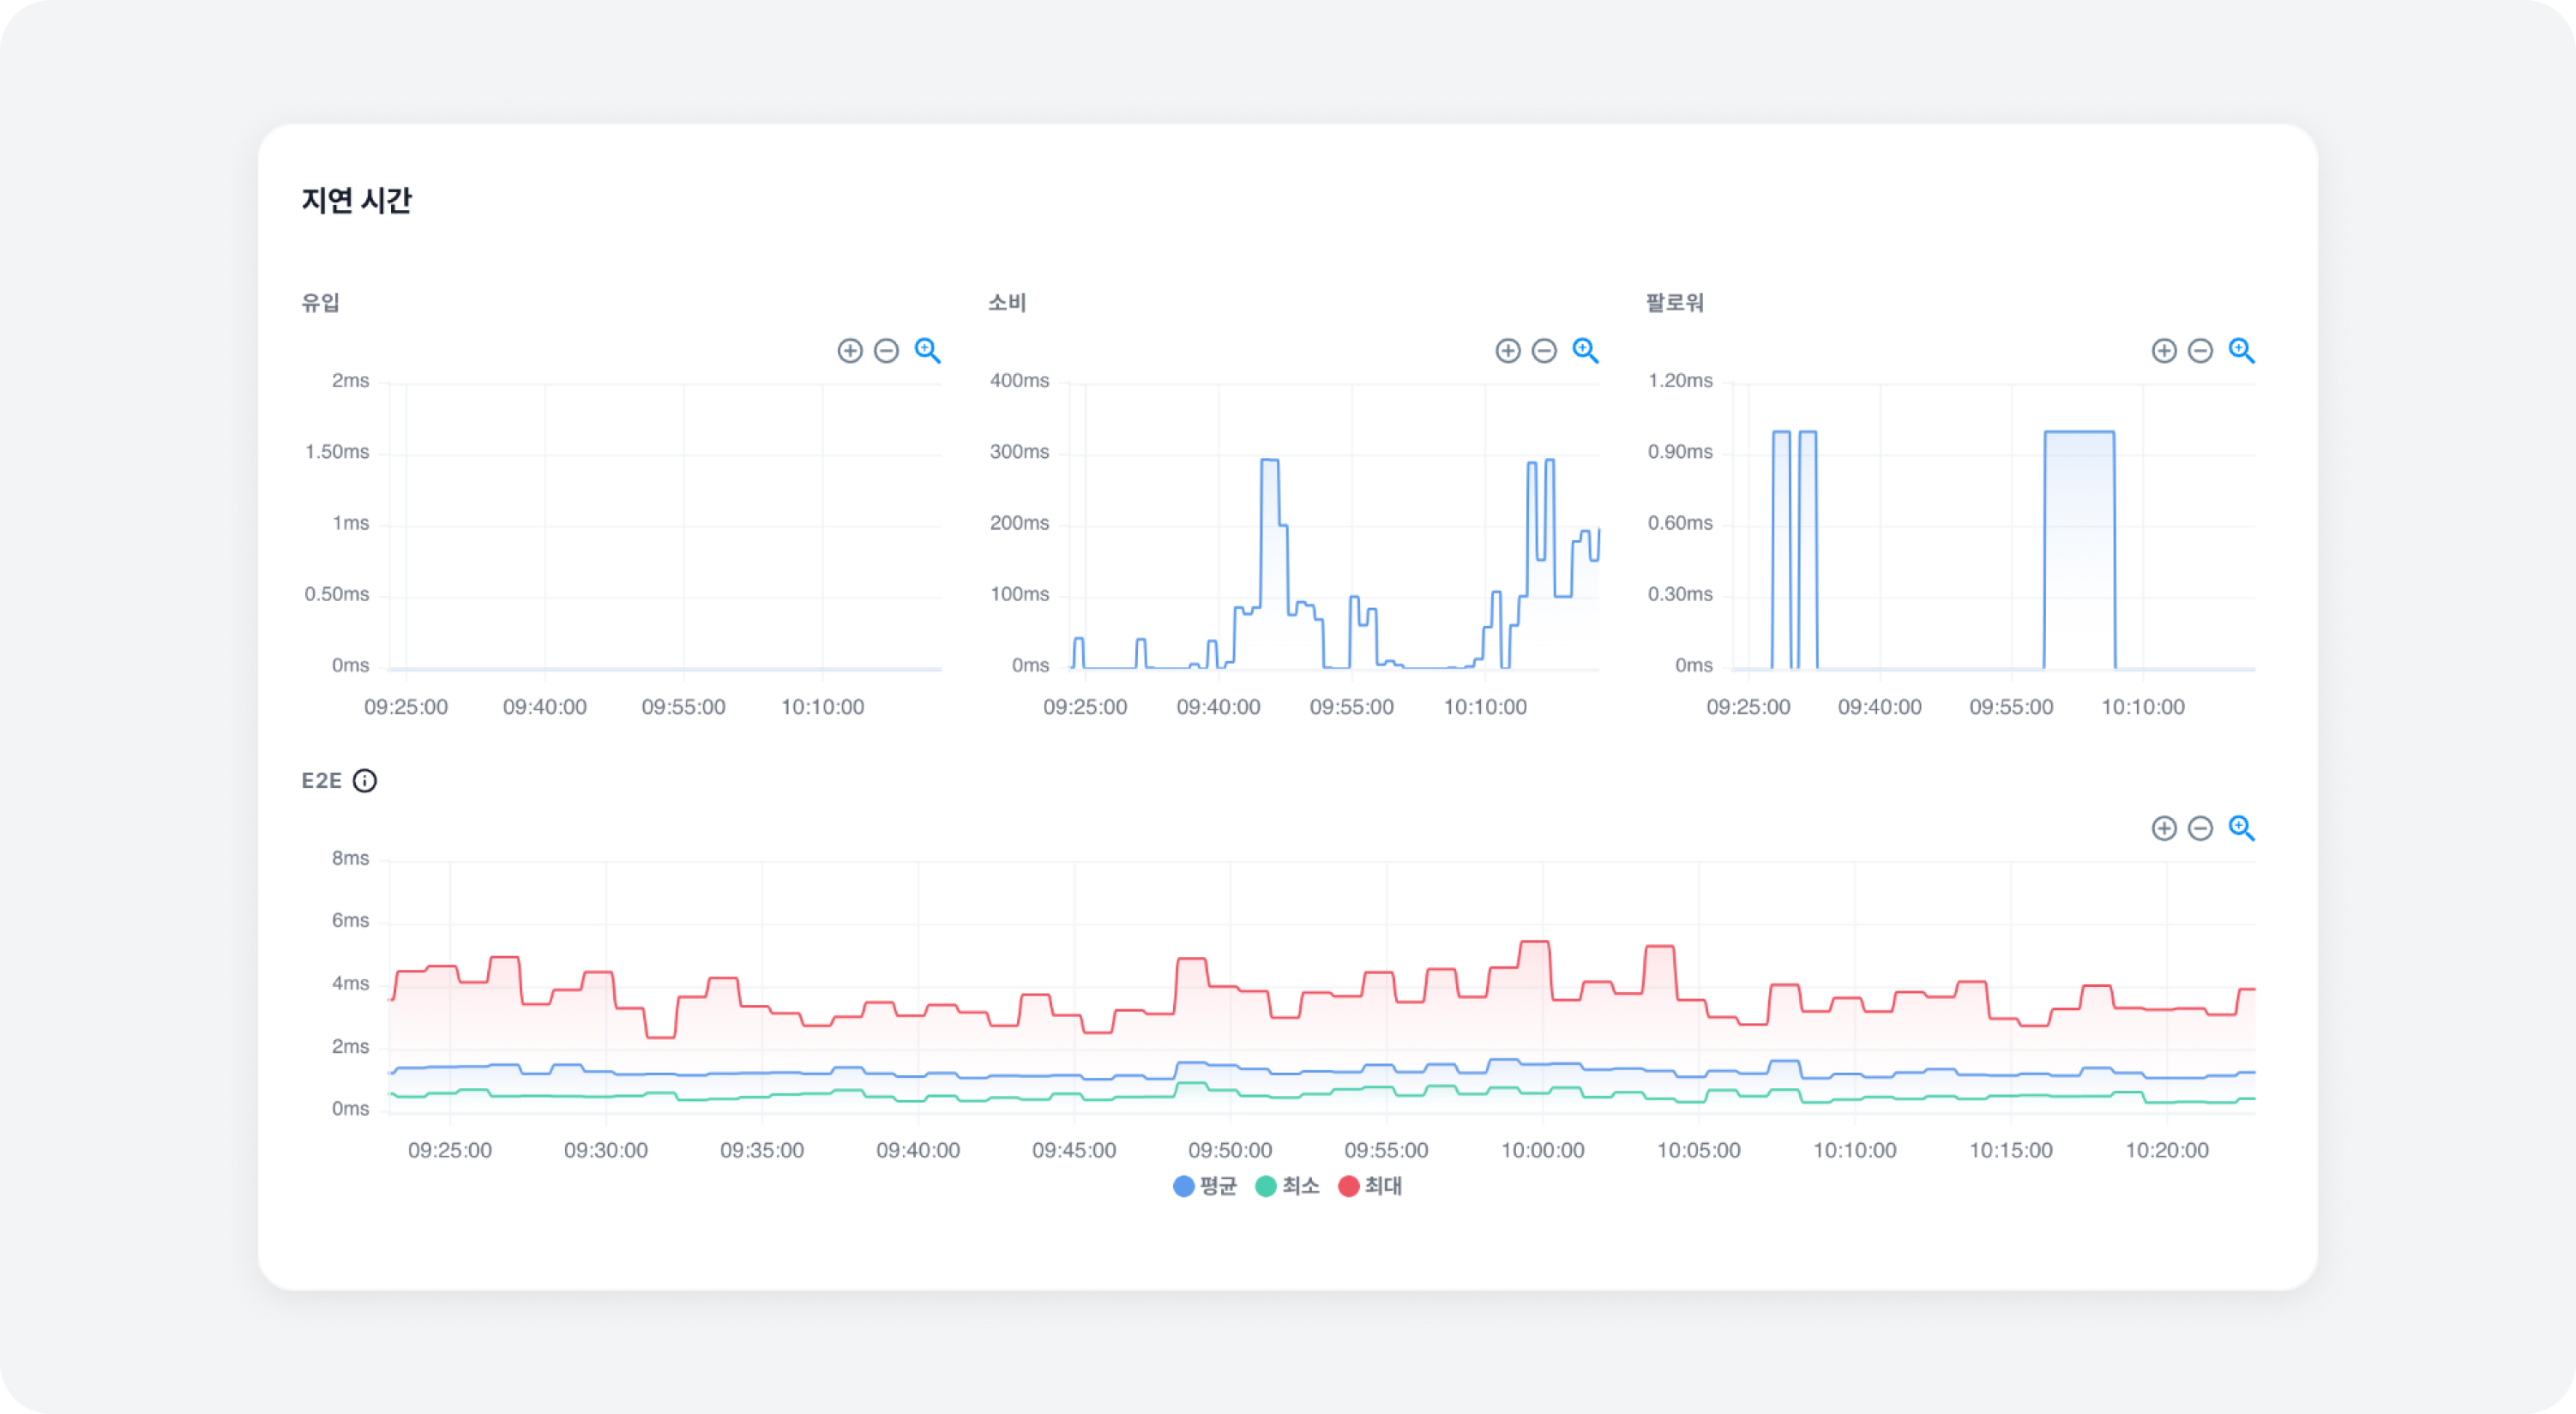
- Produce
Latency metrics history for message production requests of producer - Fetch consumer
Latency metrics history for message fetch requests of consumer - Fetch follower
Latency metrics history for message fetch requests of Partition Follower
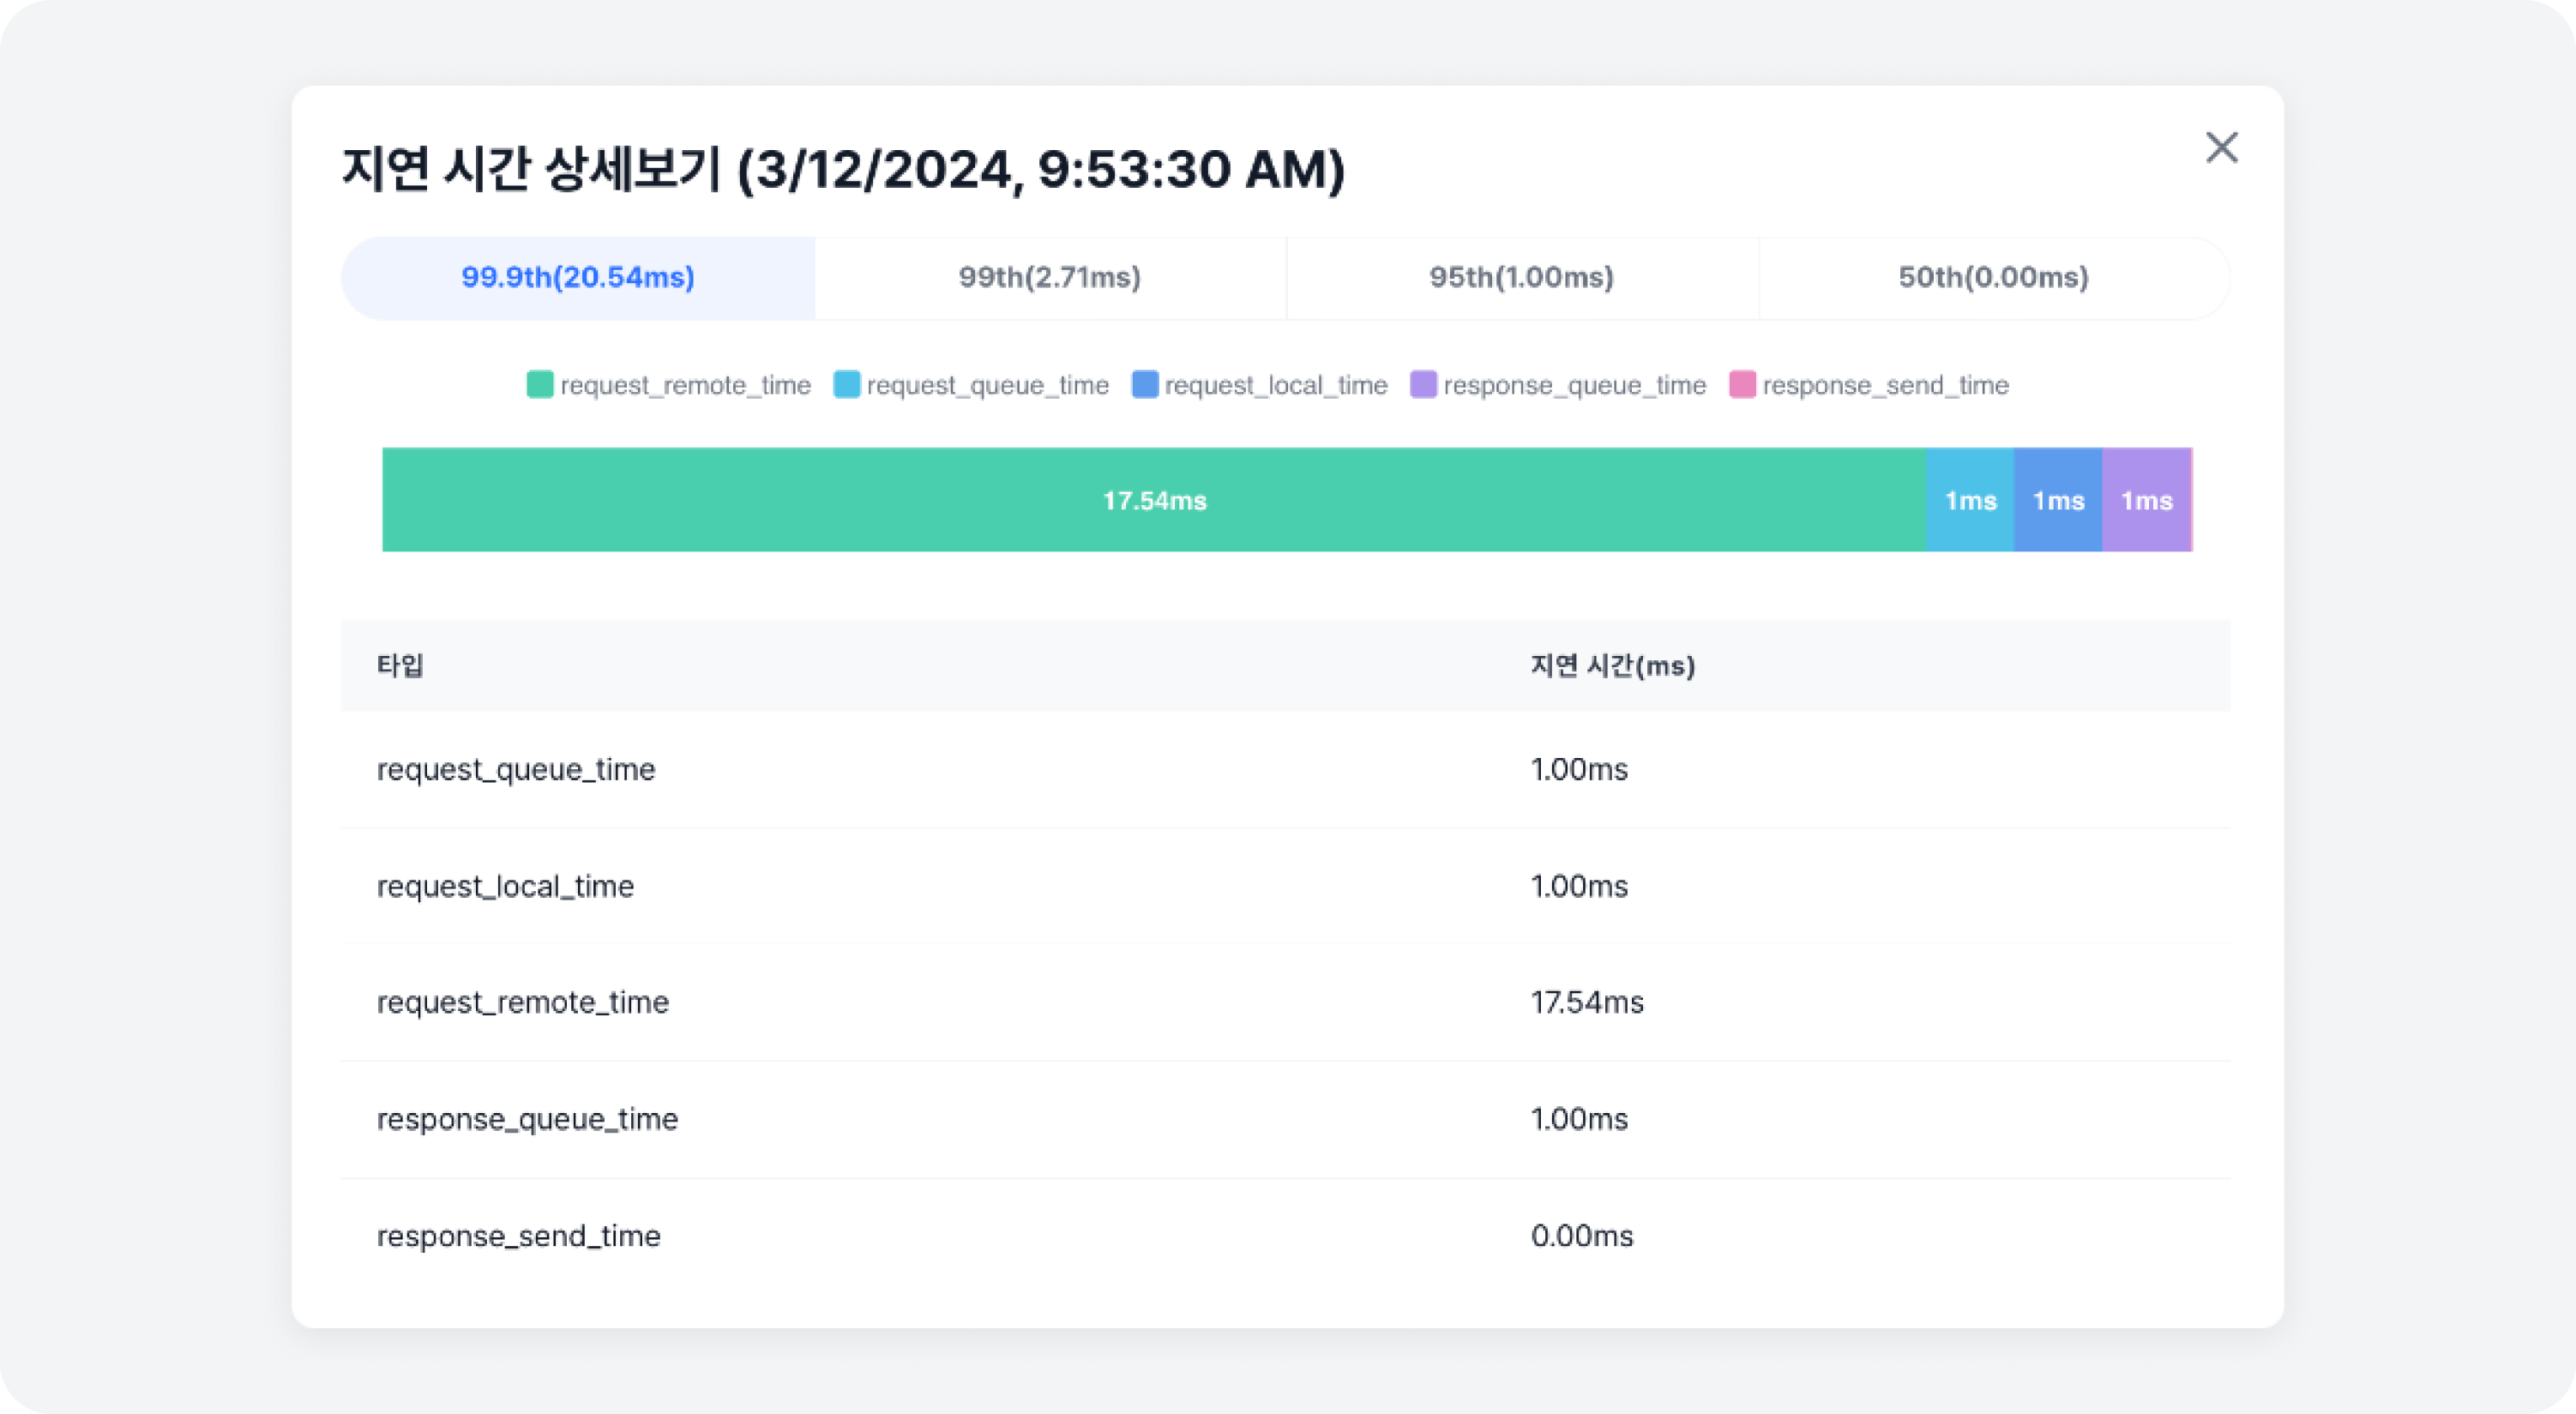
By clicking on each graph point, you can see latency details by different percentiles. (99.9%, 99%, 95%, 90%, 50%)
| Type | Description |
|---|---|
| request_queue_time | The time a request spent in the request queue |
| request_local_time | The time a response spent in the response queue |
| request_remote_time | The time taken to process a request locally (e.g., the time taken to write to the write buffer) |
| response_queue_time | The time taken to process a request remotely (e.g., the time taken for the follower to replicate) |
| response_send_time | The time taken to send the response |
-
E2E
This graph shows the latency between the time a message is generated by a producer using 'Blackbox Exporter' and the time it is consumed by a consumer, which can be used to determine the performance of the current broker.- Average: This is an indicator of average E2E latency and is useful for understanding overall system performance, but anomalous values can affect the average.
- Minimum: Represents the lowest latency (i.e., fastest response time), which means the system is operating optimally.
- Maximum: Represents the highest latency (i.e., slowest response time), indicating that the system is operating under extreme conditions.
Queue Status
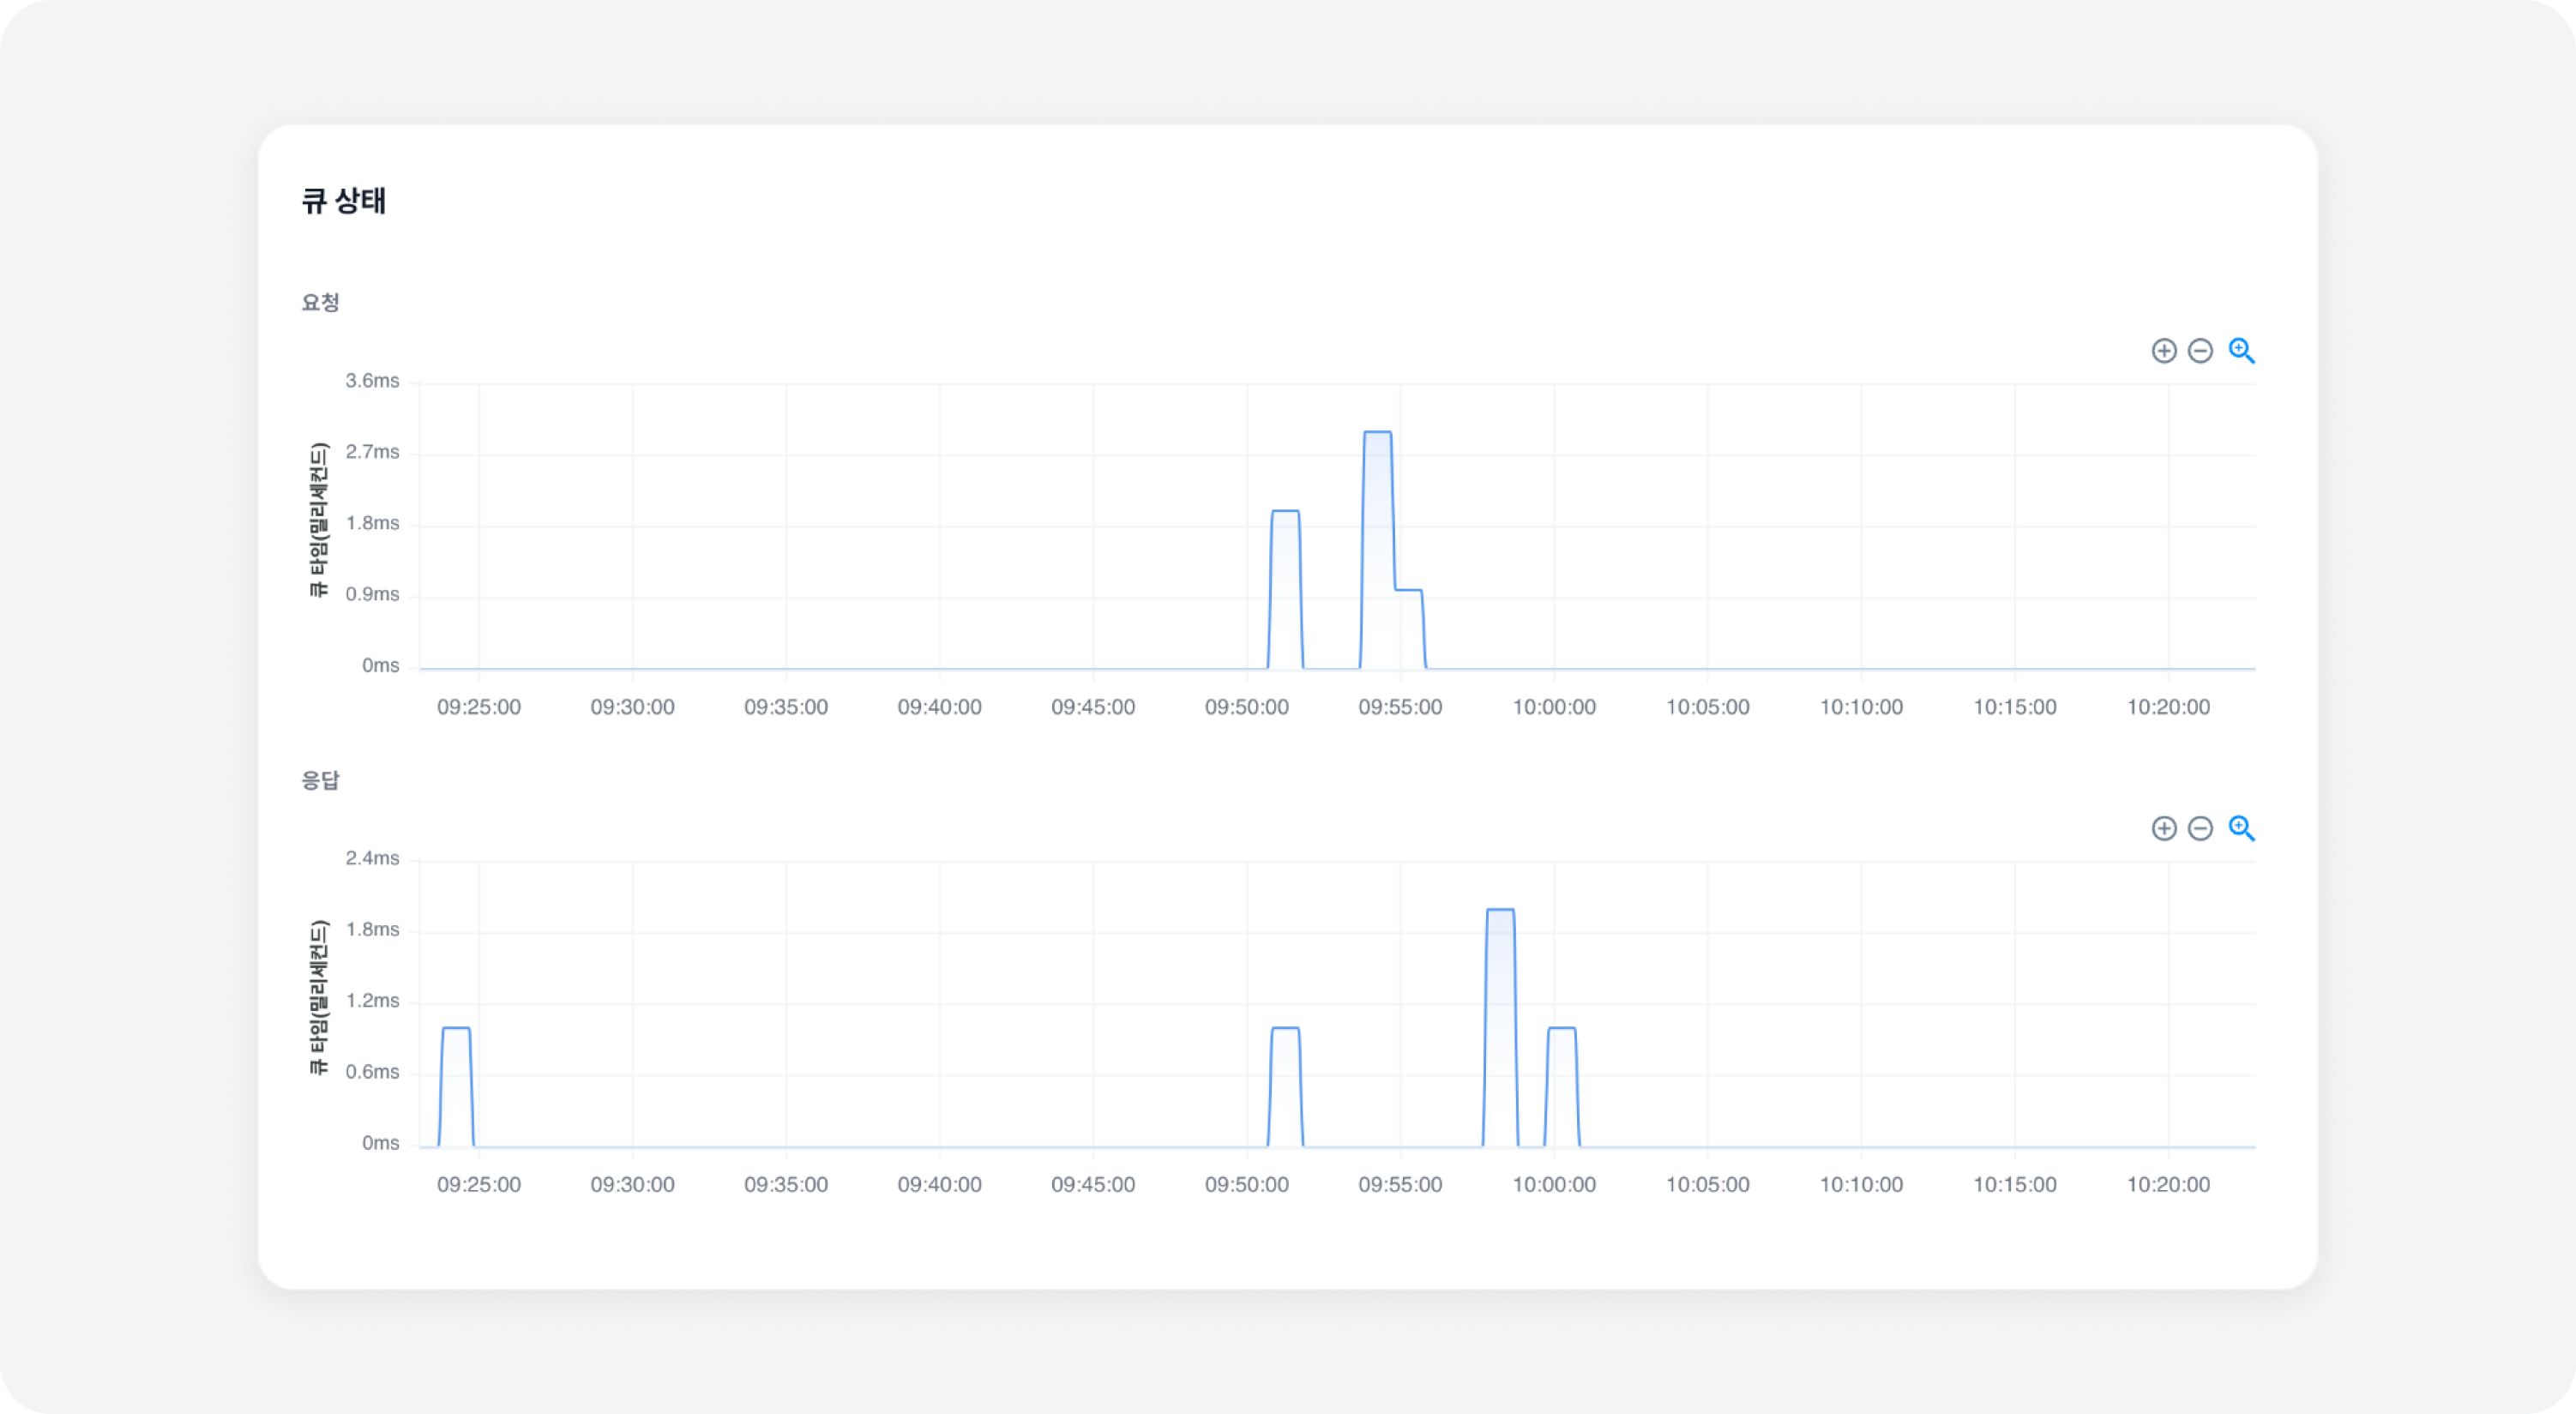
- Request
History of the time a request spent in the request_queue - Response
History of the time a response spent in the response_queue
Network Idle
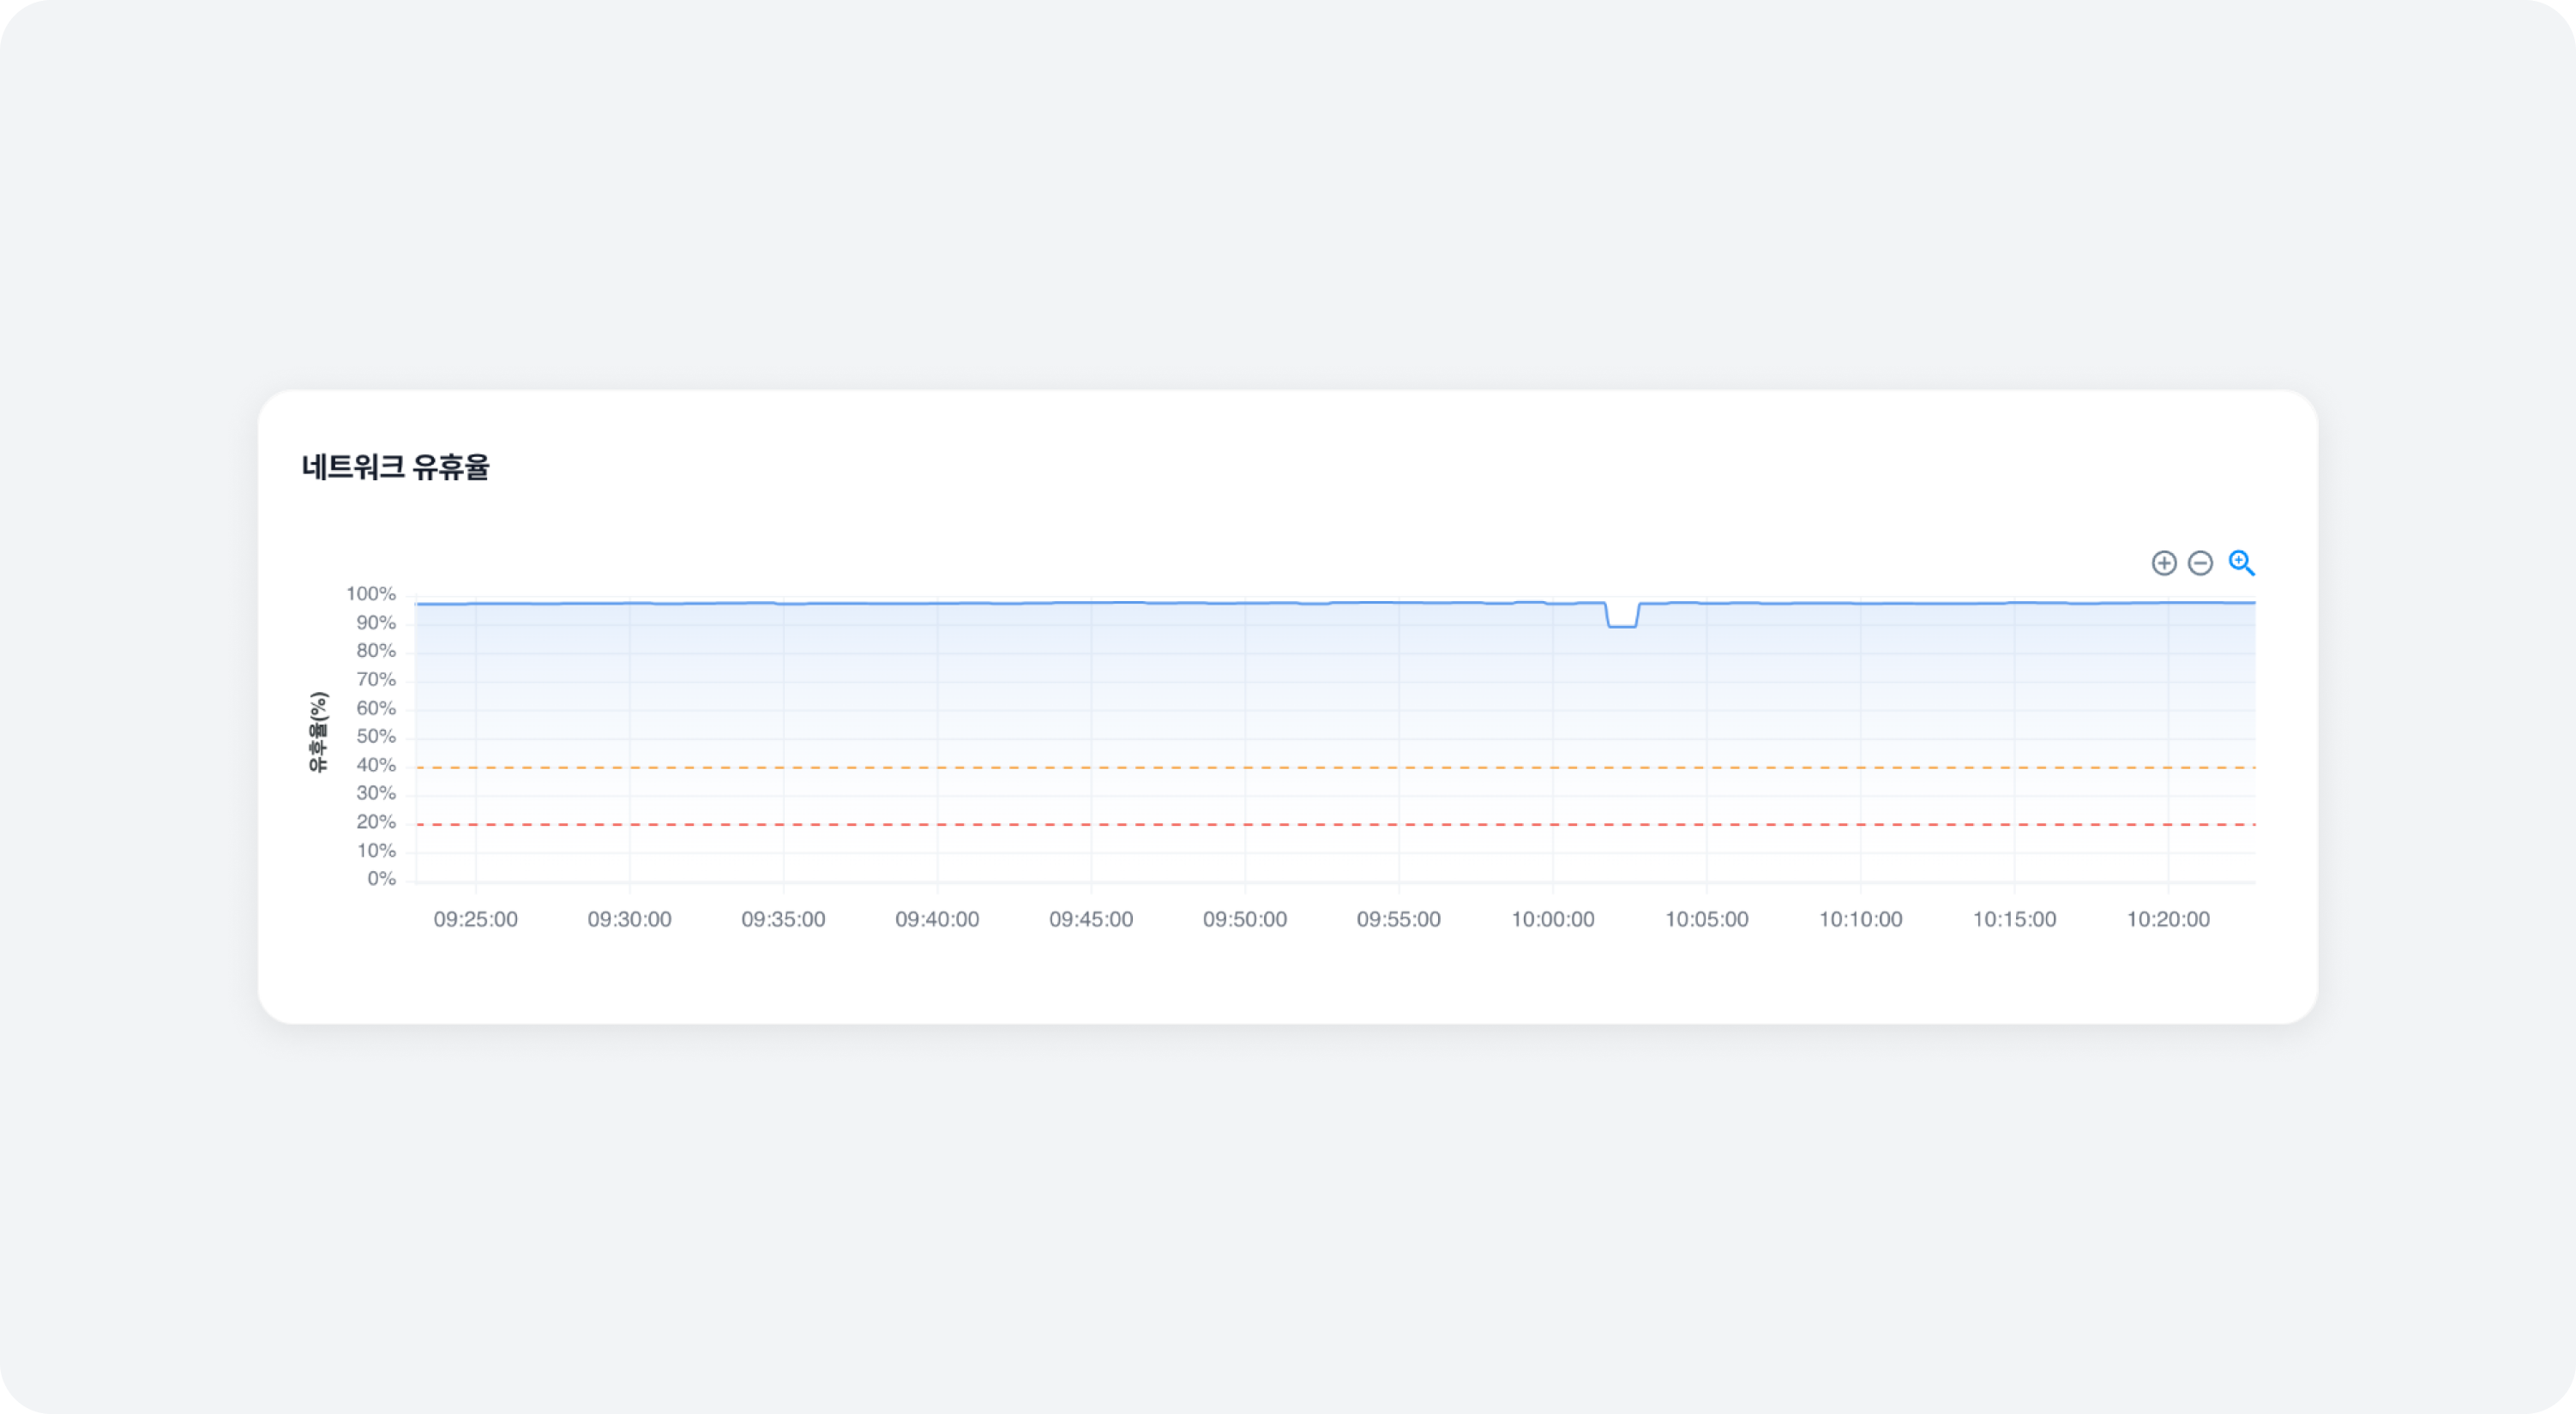
- Percentage
History of network idle rate
ZooKeeper Connection Status
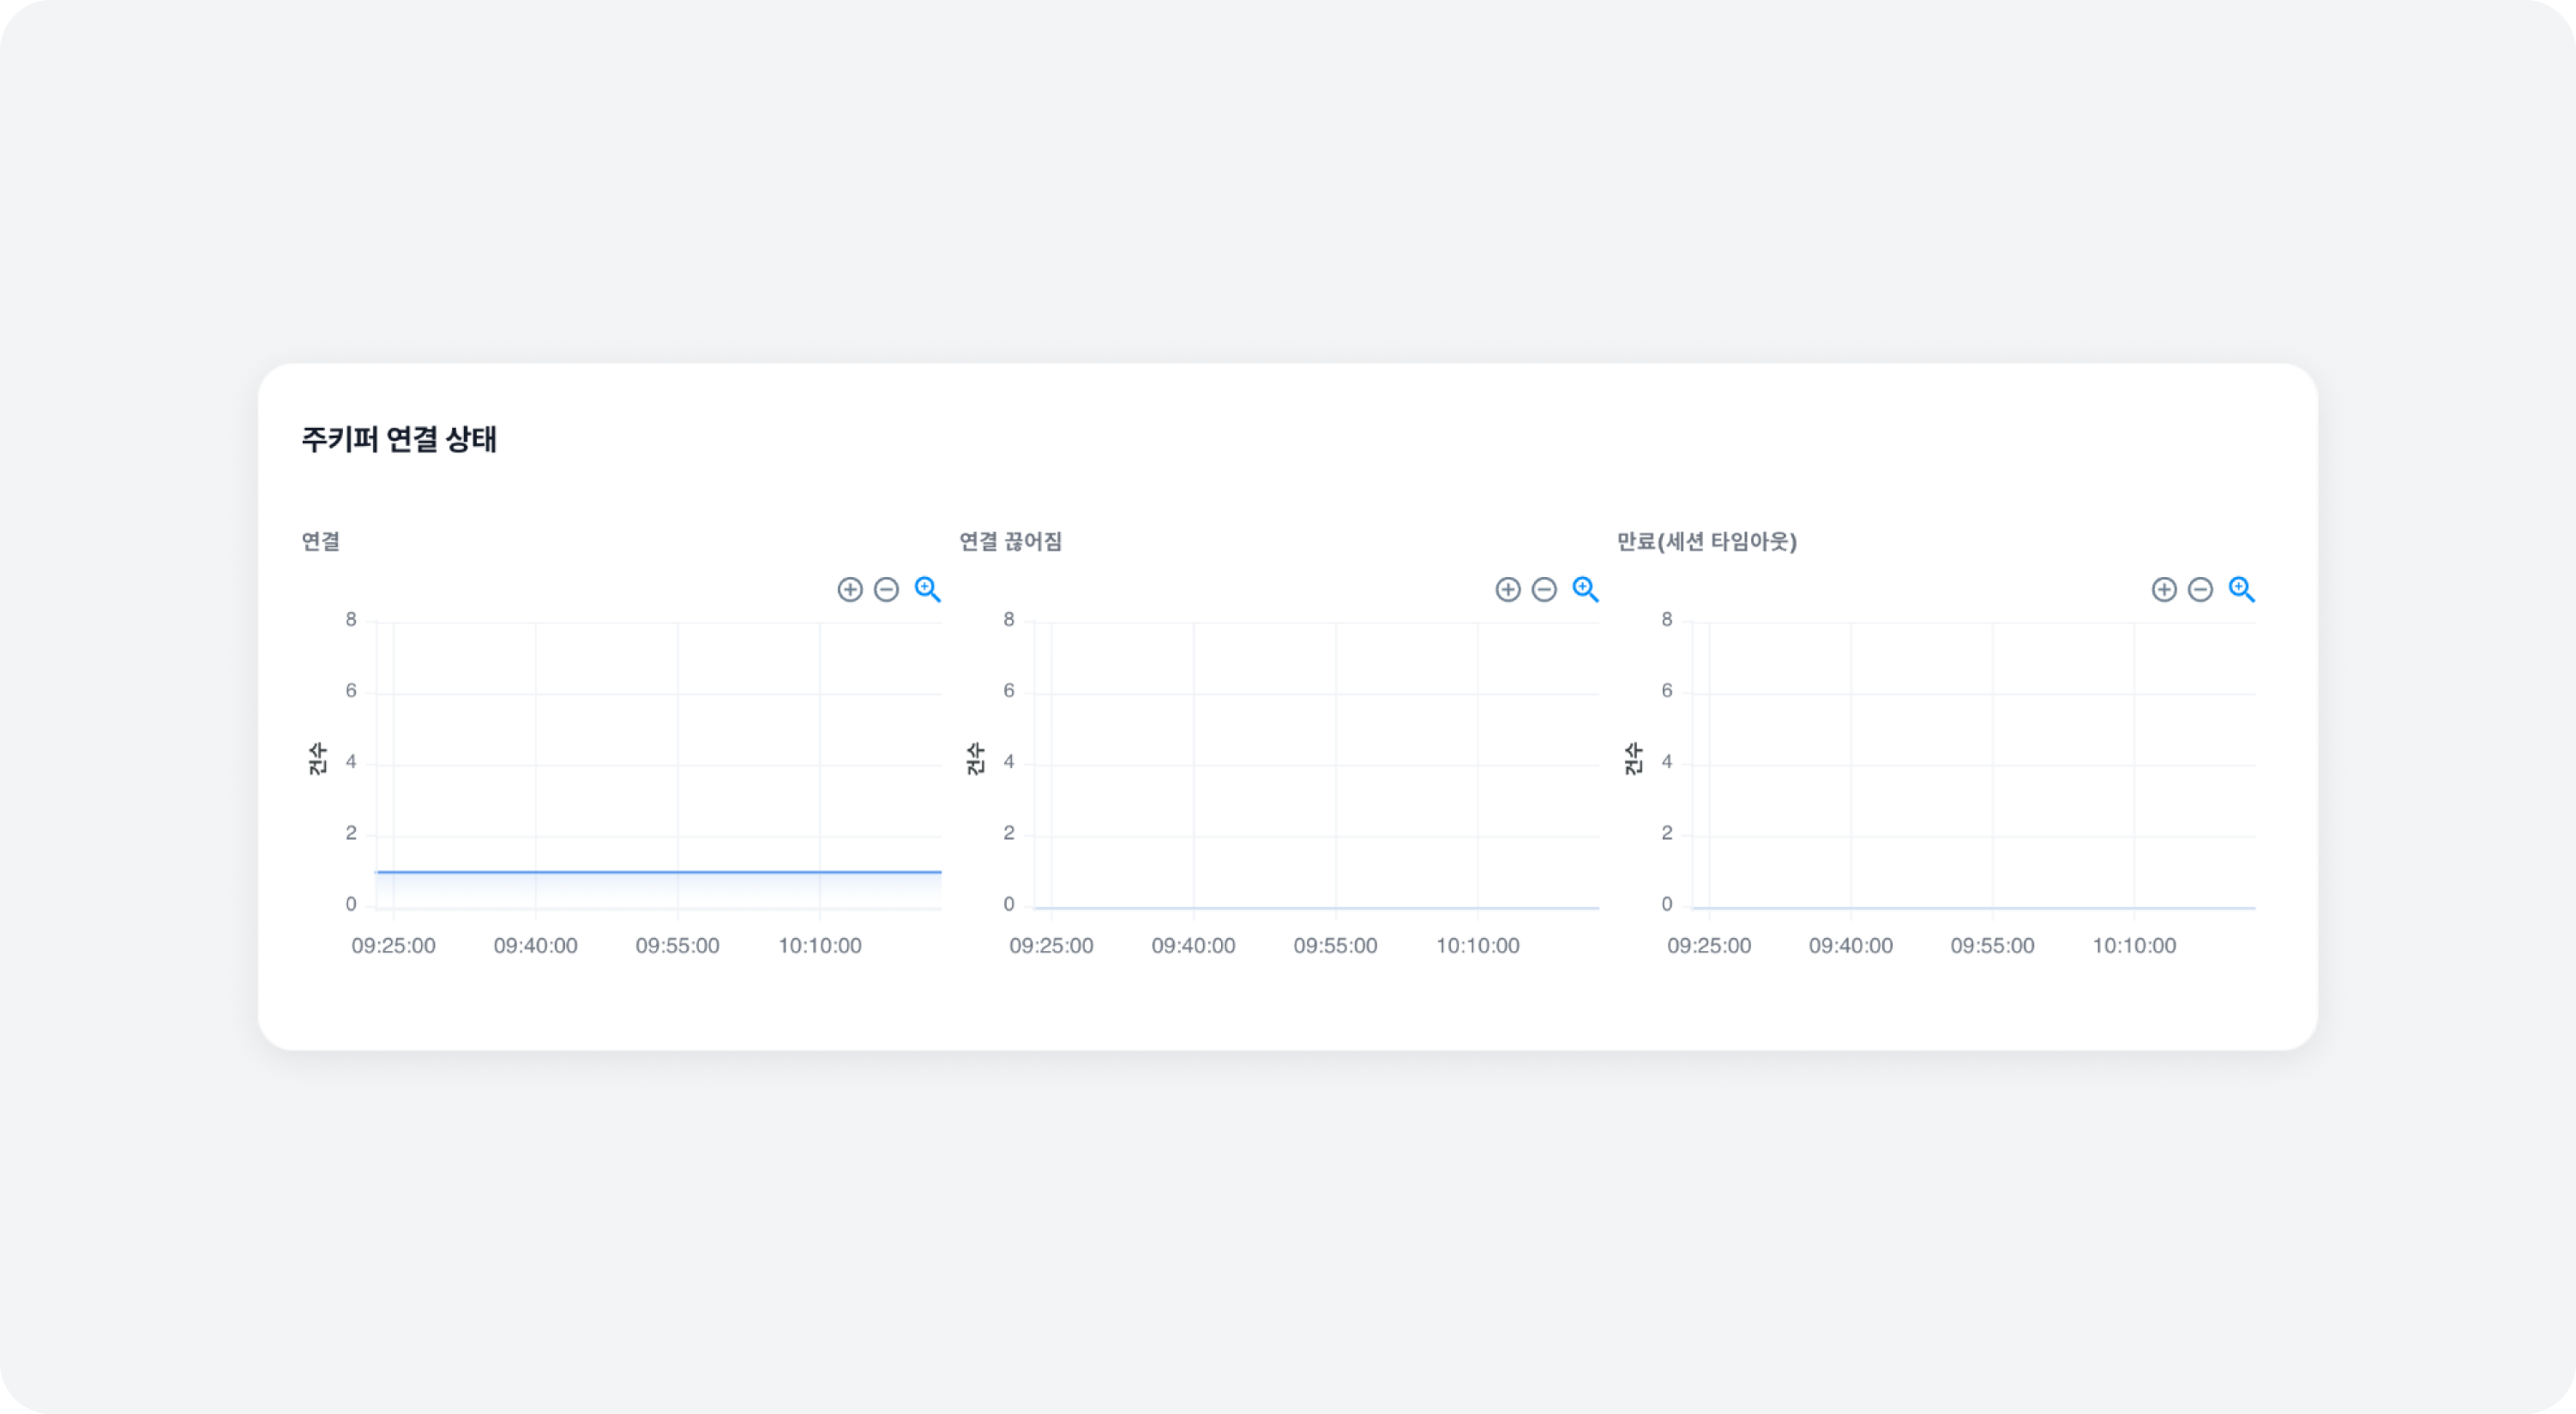
- Connection
History of the number of times connected to ZooKeeper - Disconnection
History of the number of times the connection to ZooKeeper was disconnected - Expiration (session timeout)
History of the number of times the ZooKeeper connection expired
- The number of connections is always supposed to be 1 greater than the number of disconnections, indicating the normal state.
- If the number of disconnections keeps increasing, you could suspect a network issue.
- Severe network latency or problems can cause connection expiration.
Node Metrics
You can view the time series graphs of data collected from the nodes or pods where the Kafka Brokers are running. In a container environment, node metrics might display data from worker nodes, depending on the situation.
Disk Usage
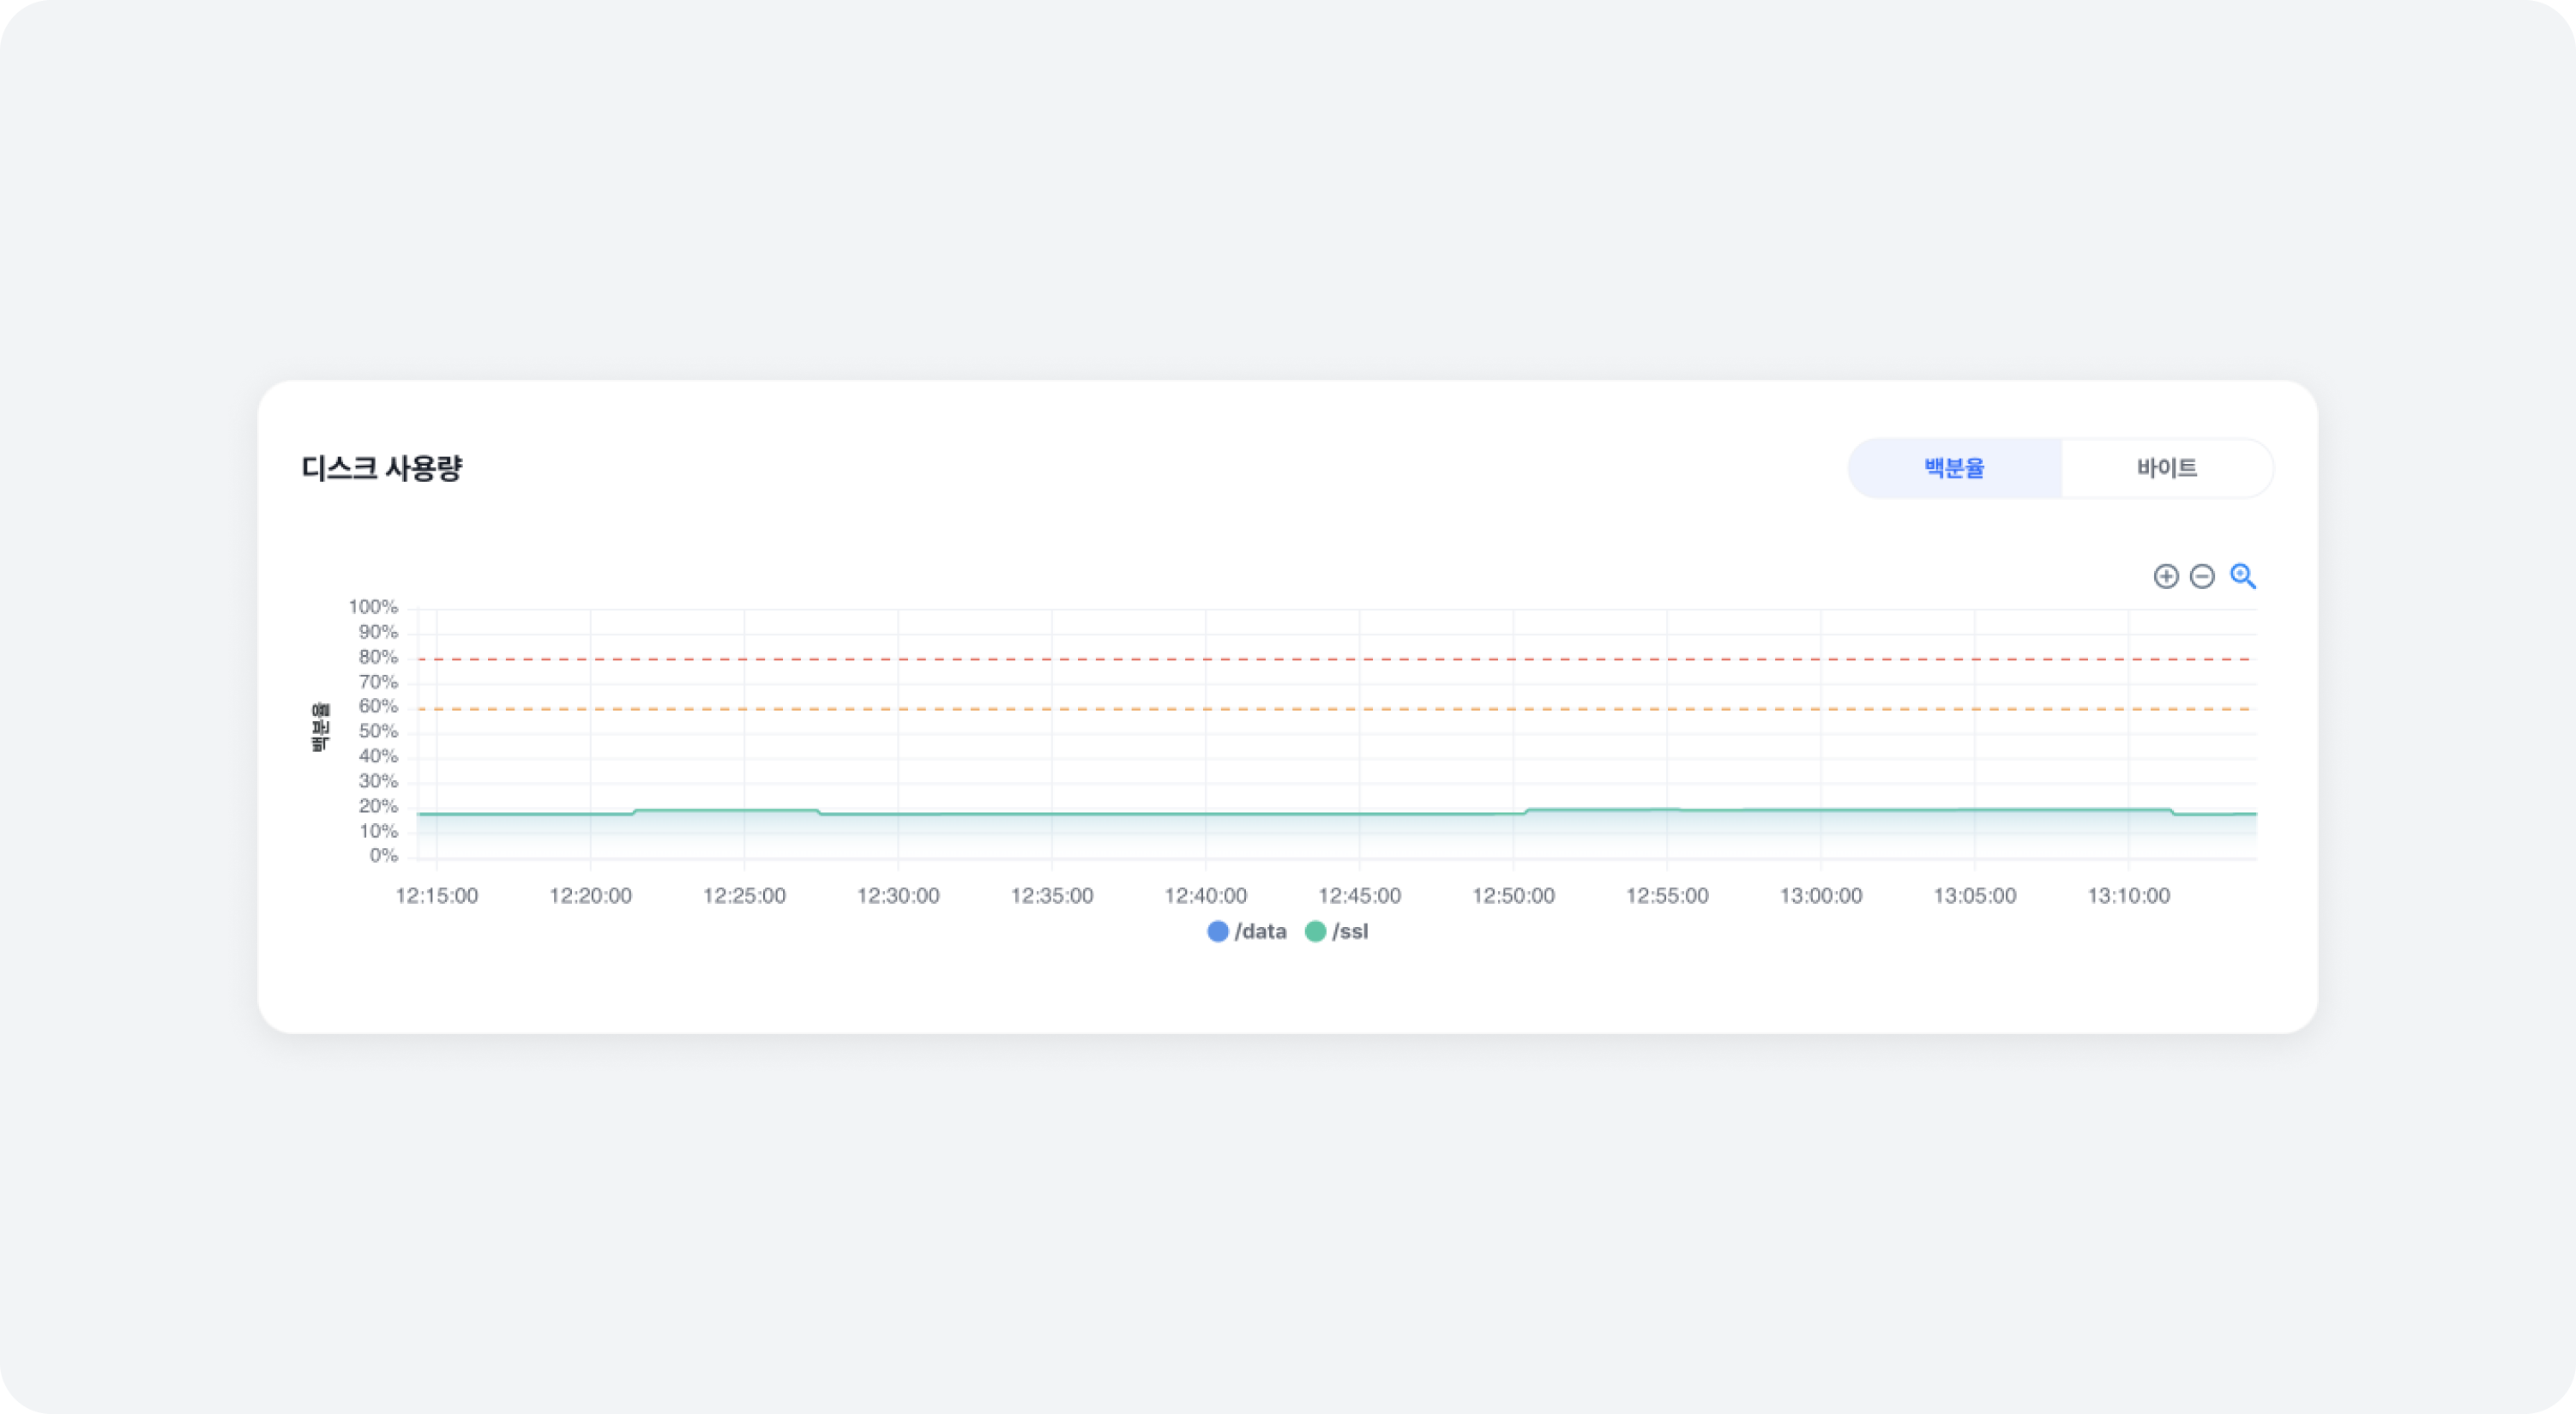
- Percentage
History of disk usage rate by major mount points - Bytes
History of disk usage by major mount points
Memory Usage
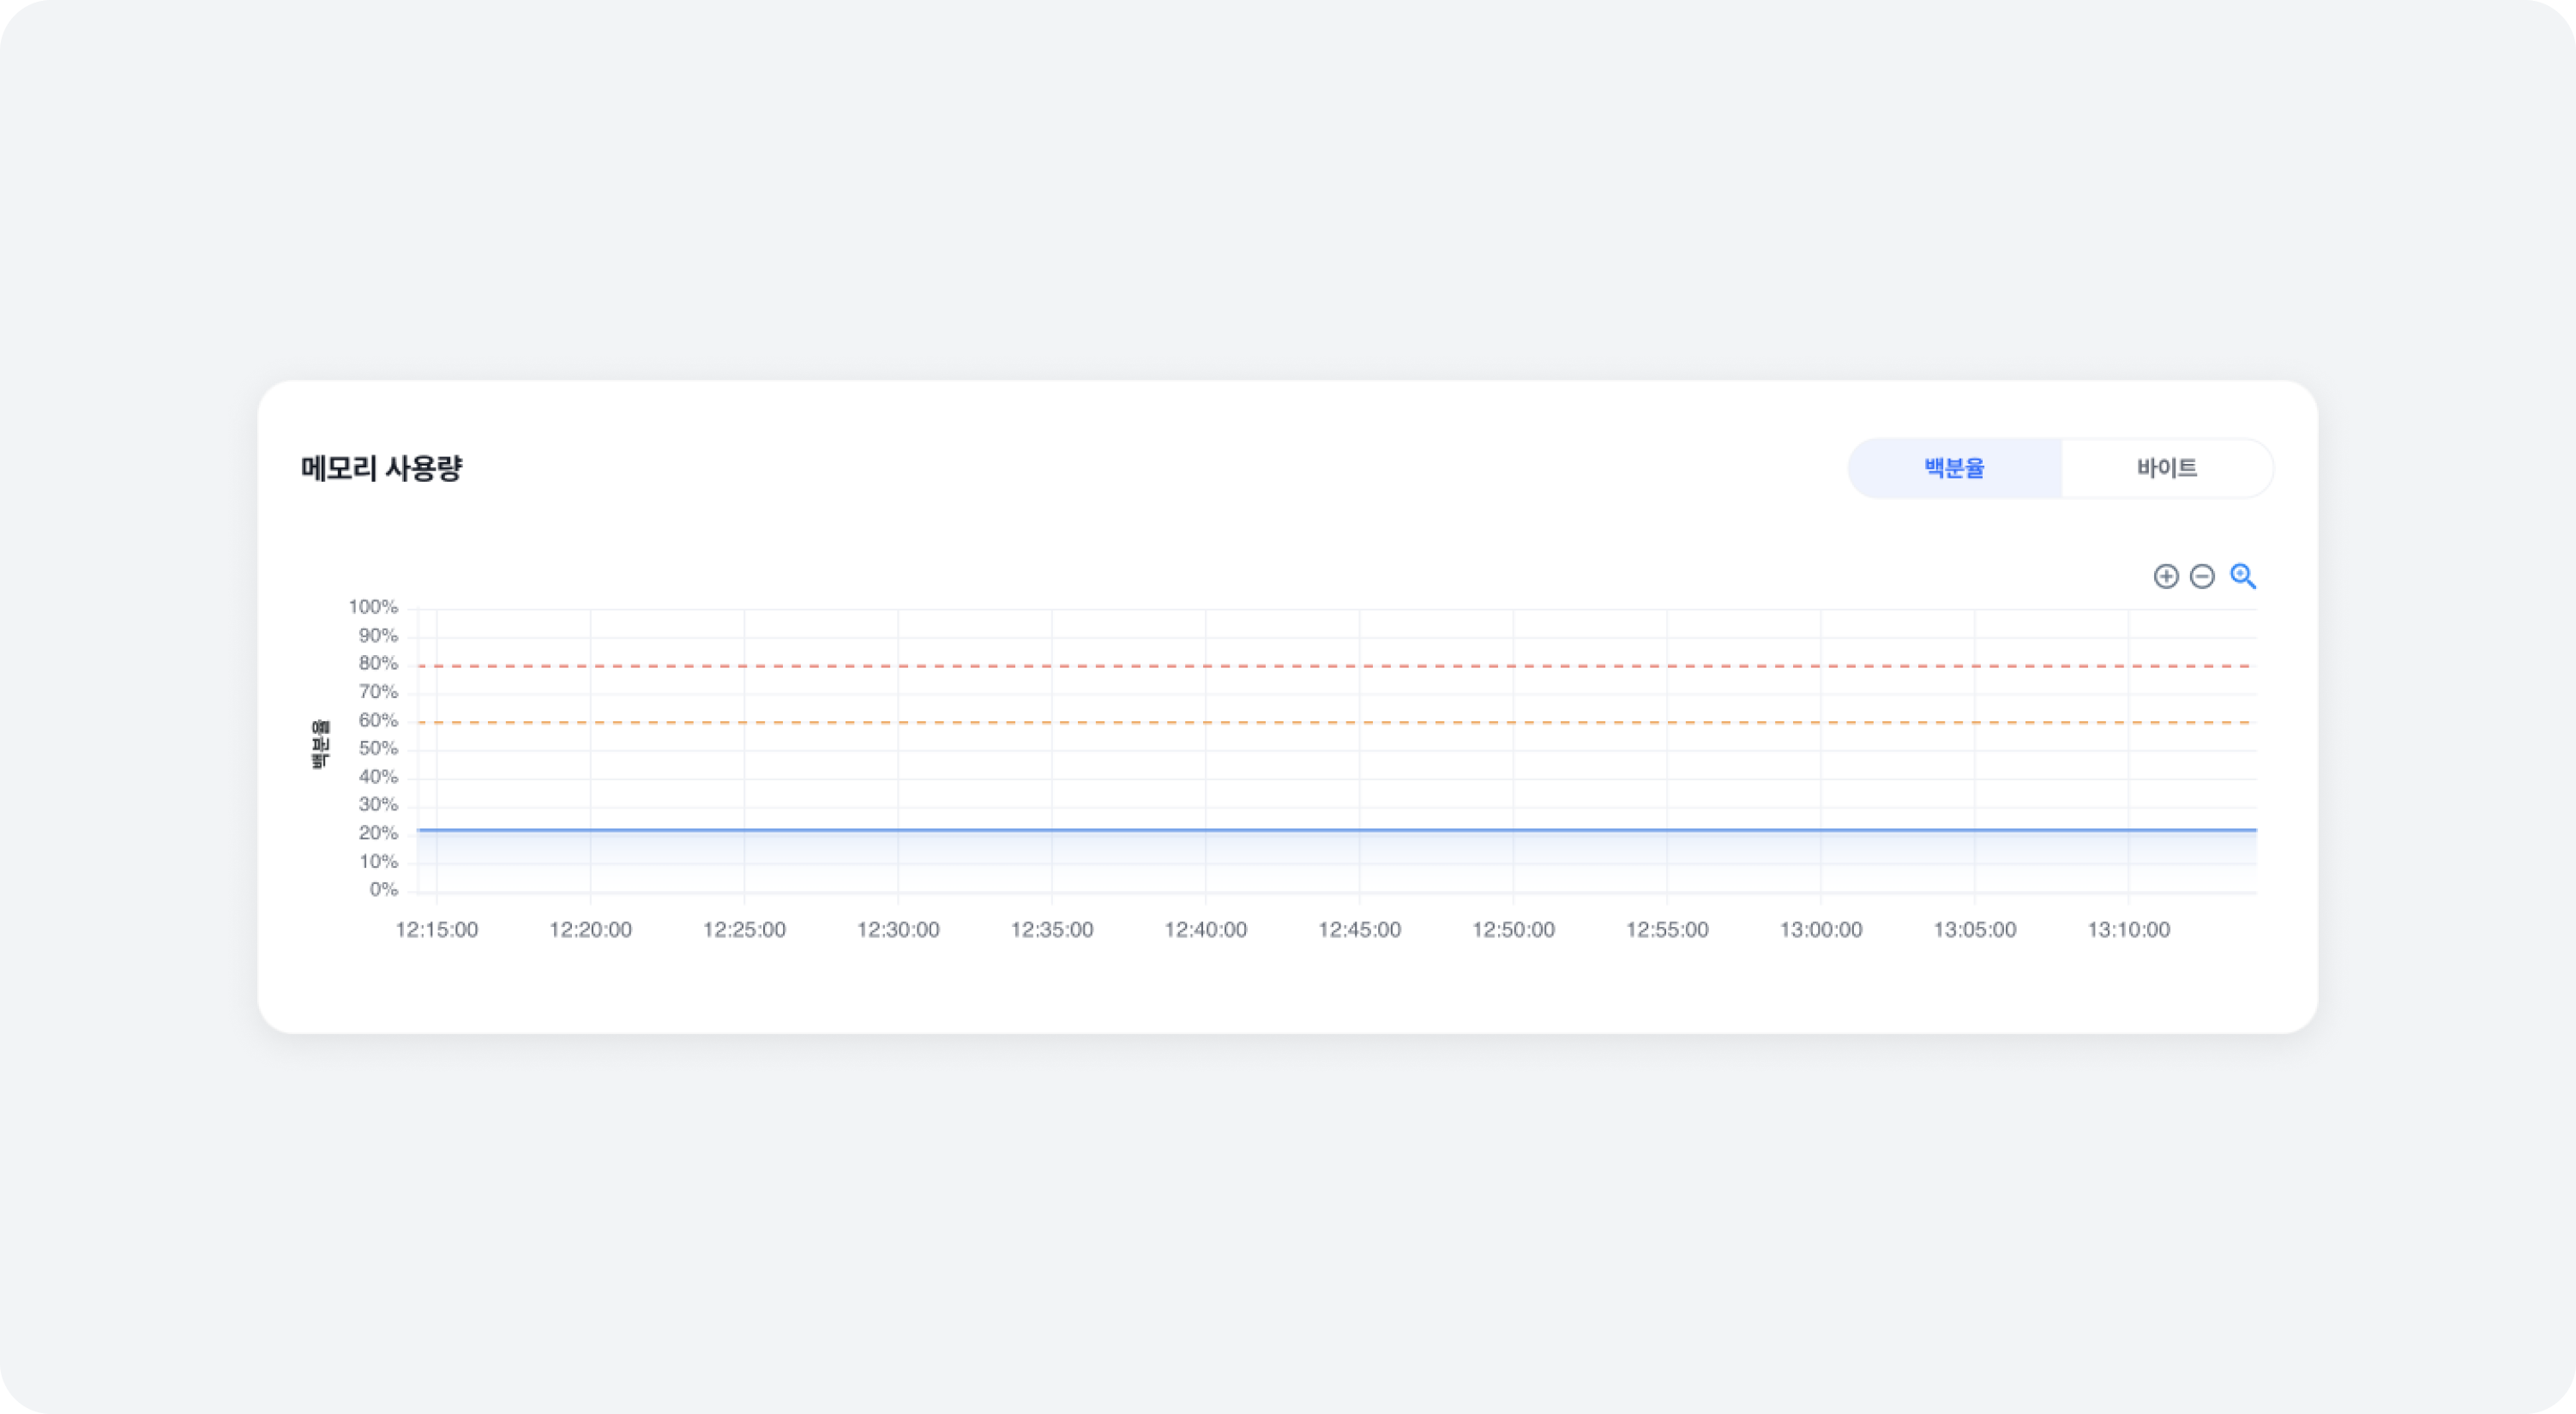
- Percentage
History of memory usage rate - Bytes
History of memory usage
CPU Usage
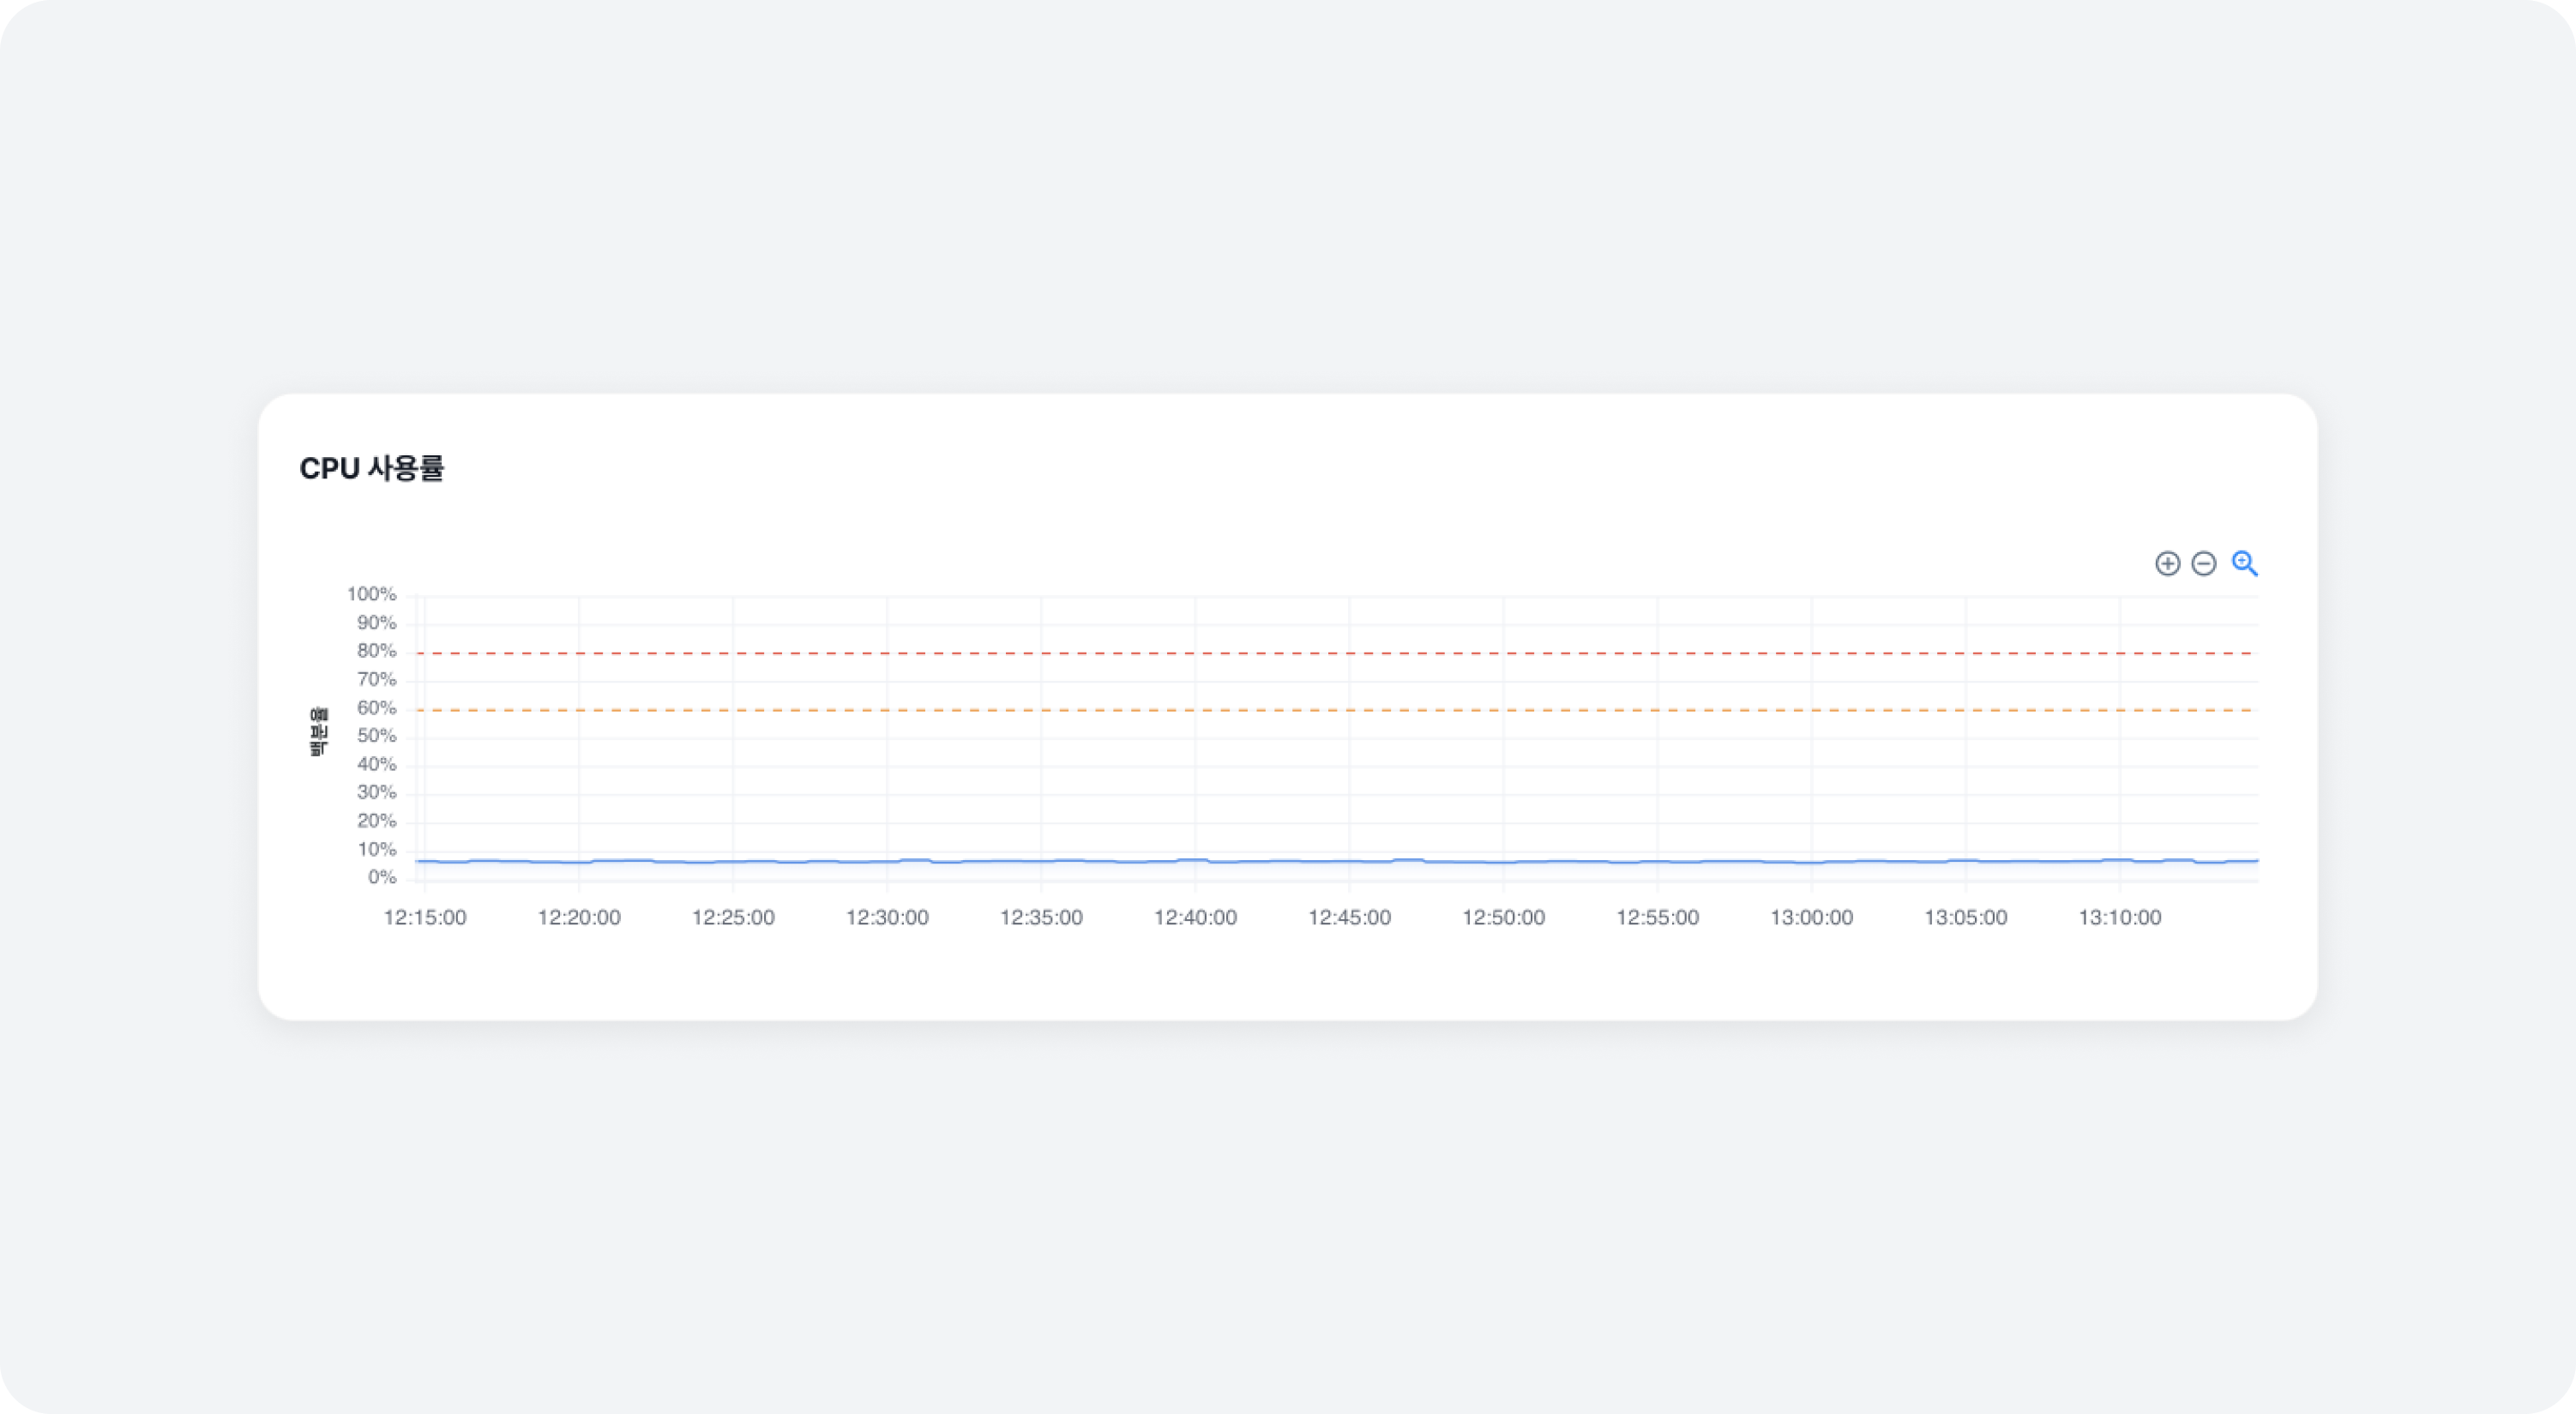
- Percentage (Percent)
History of CPU usage
Error Metrics
You can view the errors and processing failures that occur during message processing (Produce, Consume) in Kafka Brokers, as time series graphs. Clicking on the occurrence points will provide detailed information.
Total Error Count
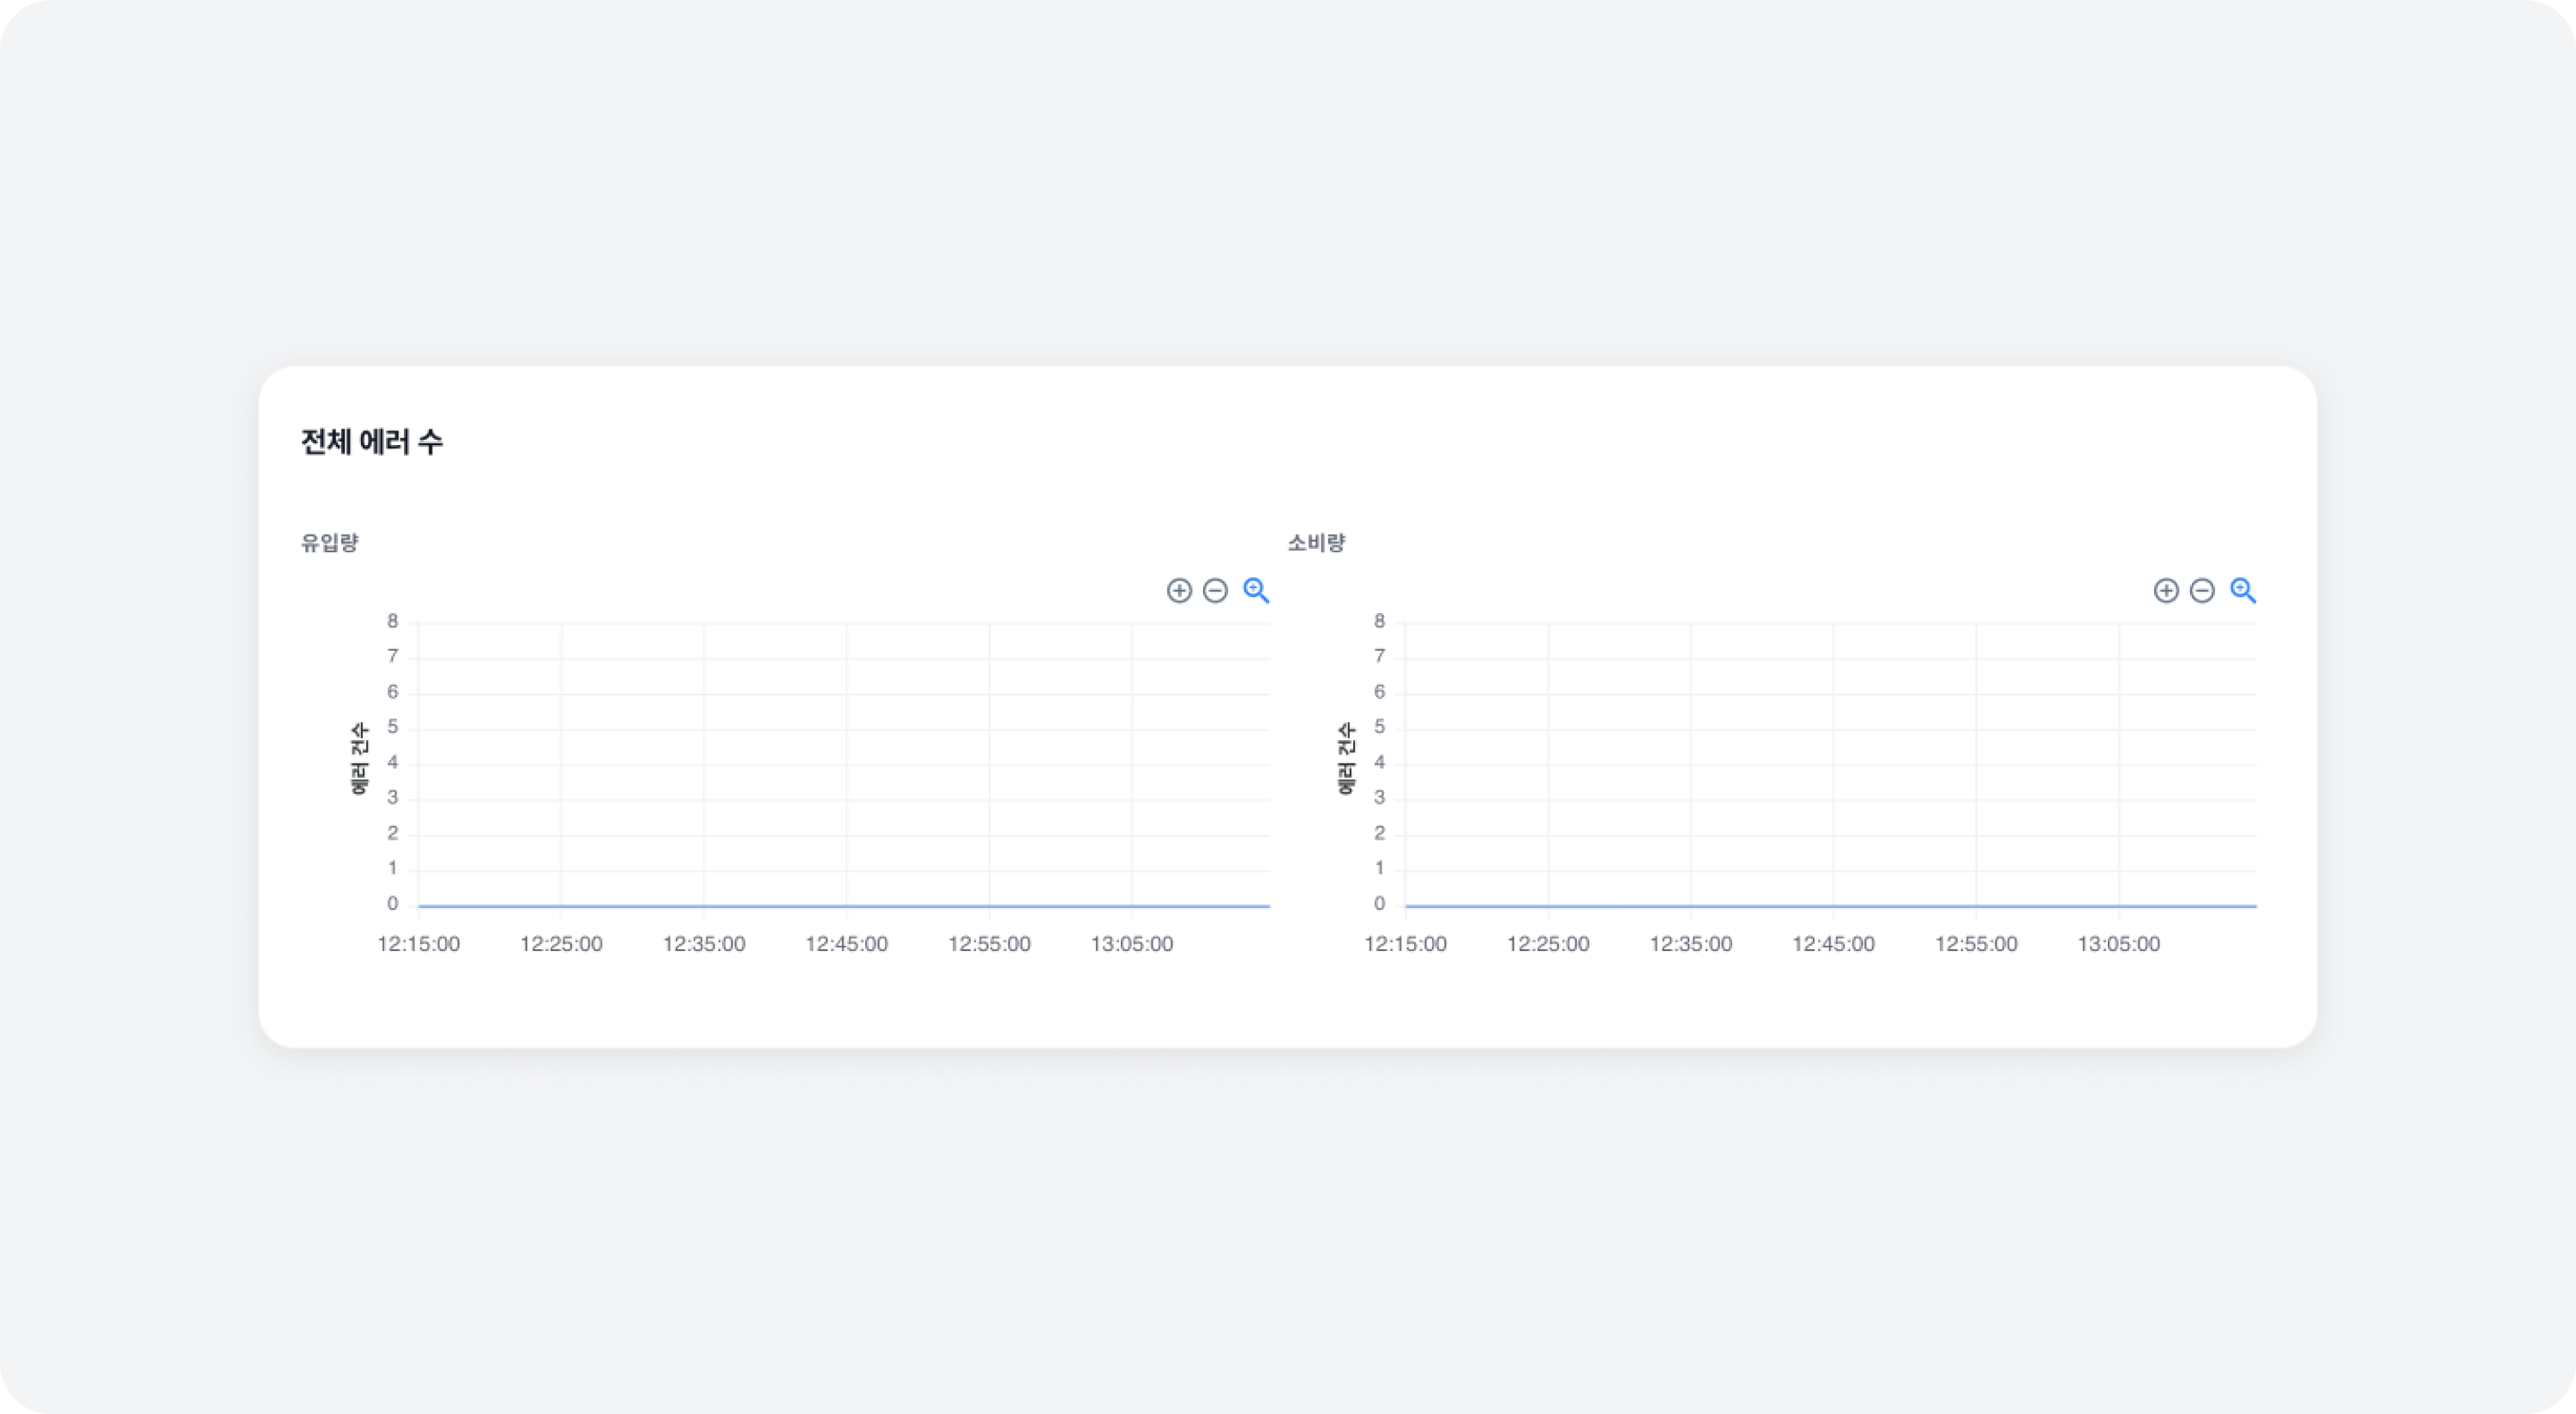 This metric shows all errors that occurred during message processing (Produce, Consume). Clicking on an error count occurrence point will provide detailed information on which requests generated the errors and how many times they occurred.
- Production
Number of errors that occurred during production - Consumption
Number of errors that occurred during consumption
Processing Failure Count
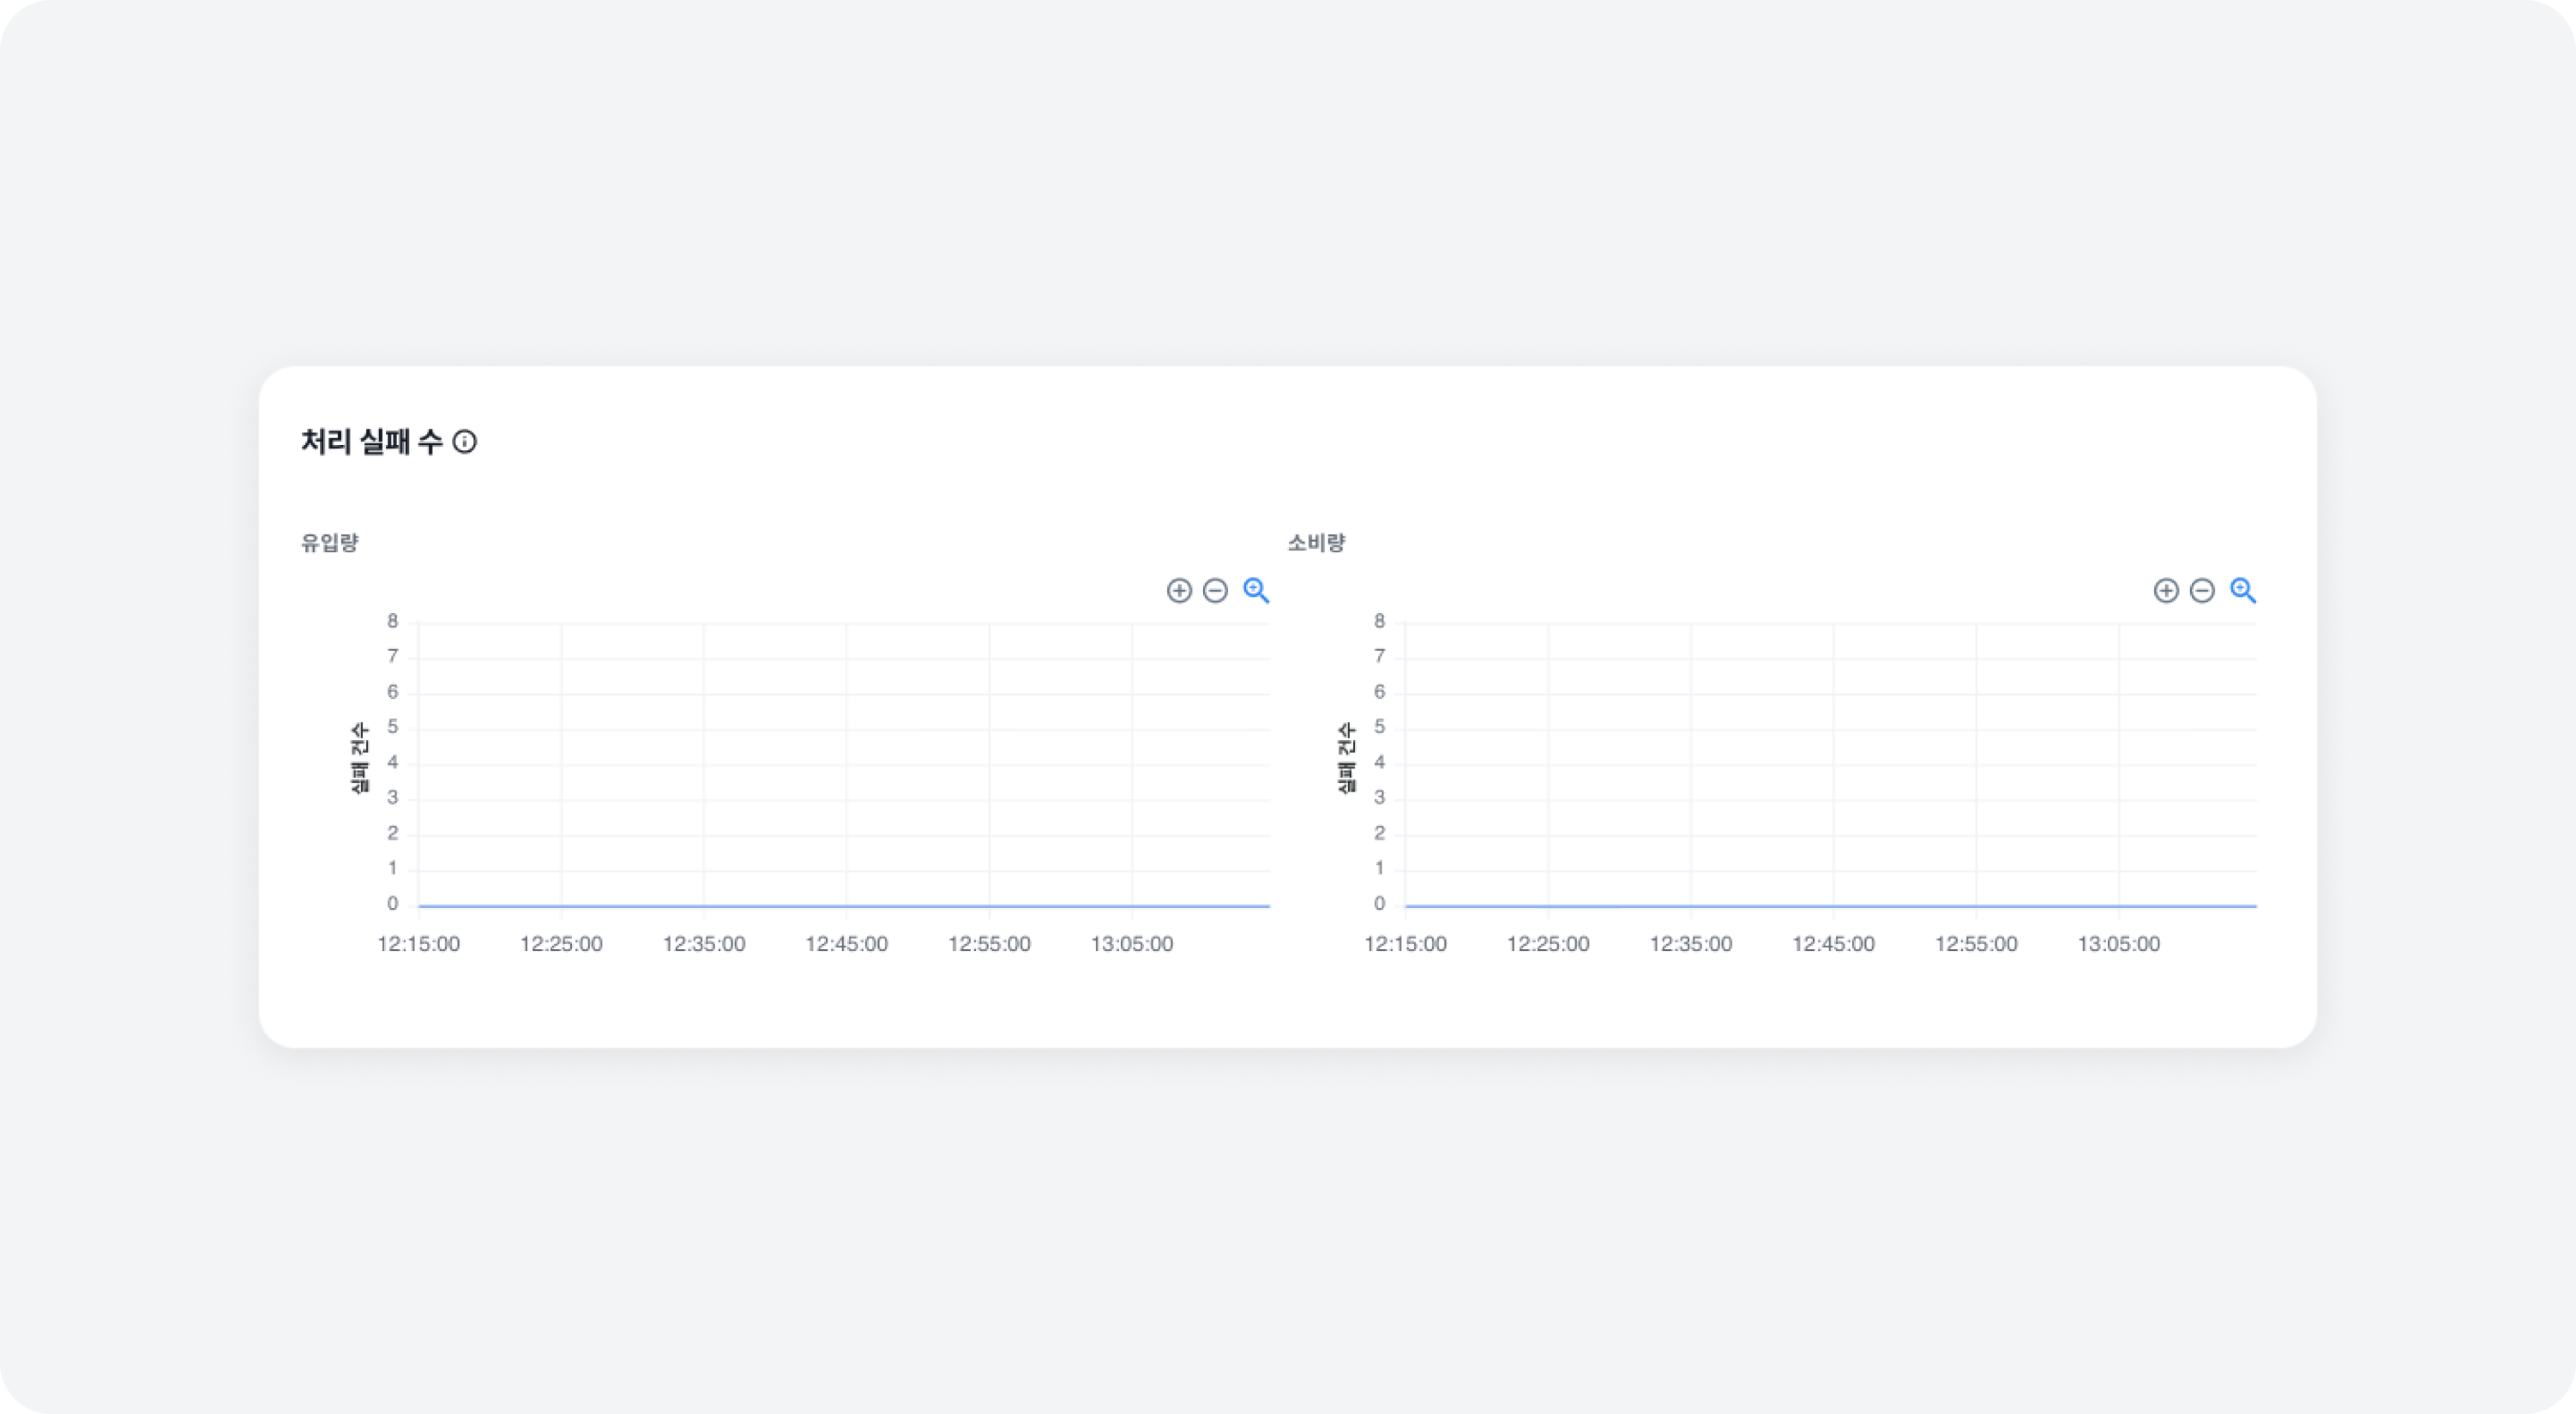 This metric narrows down the range of potential errors that can occur during message processing (Produce, Consume). Clicking on a processing failure count occurrence point will provide detailed information on where the processing failure occurred in terms of the specific topic.
- Production
Number of errors that occurred during production - Consumption
Number of errors that occurred during consumption