Insight
Introduction
While operating a Kafka cluster, you may need monthly insights. Felice provides insights to help users manage Kafka more easily.
You can check and regenerate insights per cluster by selecting Advanced > Insight from the menu.
Insight is a feature available from version 2.11. Since it requires time for aggregation, the feature is not immediately usable upon installation.
The aggregation process runs at 00:00 UTC on the 1st of the month following installation. It completes within about 10 minutes, and insights become available afterward.
(e.g., If version 2.11 is installed on April 4, 2025, insights for April will be available after 00:00 UTC on May 1, 2025.)
If metrics are not applied to the cluster, certain metric-based aggregations may not be available.
Metrics unavailable without JMX exporter
- Number of brokers
- Number of topics
- Topic usage
- Number of partitions
- Partition usage
- Number of under-replicated partitions
- Some Felice alert counts (system / admin)
- Number of broker request errors
- Number of partitions below minimum ISR
- Producing latency
- Consuming latency
- Follower fetch latency
- Broker-level producing latency
- Broker-level consuming latency
- Broker-level follower fetch latency
- Producing latency (time series)
- Consuming latency (time series)
- Follower fetch latency (time series)
- Messages per second
- Incoming bytes per second
- Outgoing bytes per second
- Broker-level messages per second
- Broker-level incoming bytes per second
- Broker-level outgoing bytes per second
- Message count (time series)
- Incoming bytes (time series)
- Outgoing bytes (time series)
Metrics unavailable without Node exporter
- Some Felice alert counts (system / admin)
- CPU usage per broker
- CPU usage (time series)
- Disk usage (time series)
- Disk usage by mount point (percentage/bytes)
Insight
You can view aggregated metrics and changes for a selected month and cluster.
Regenerate Insight
There may be cases where certain insight items fail to generate. If an item is eligible for regeneration, the corresponding section will be activated as shown below:
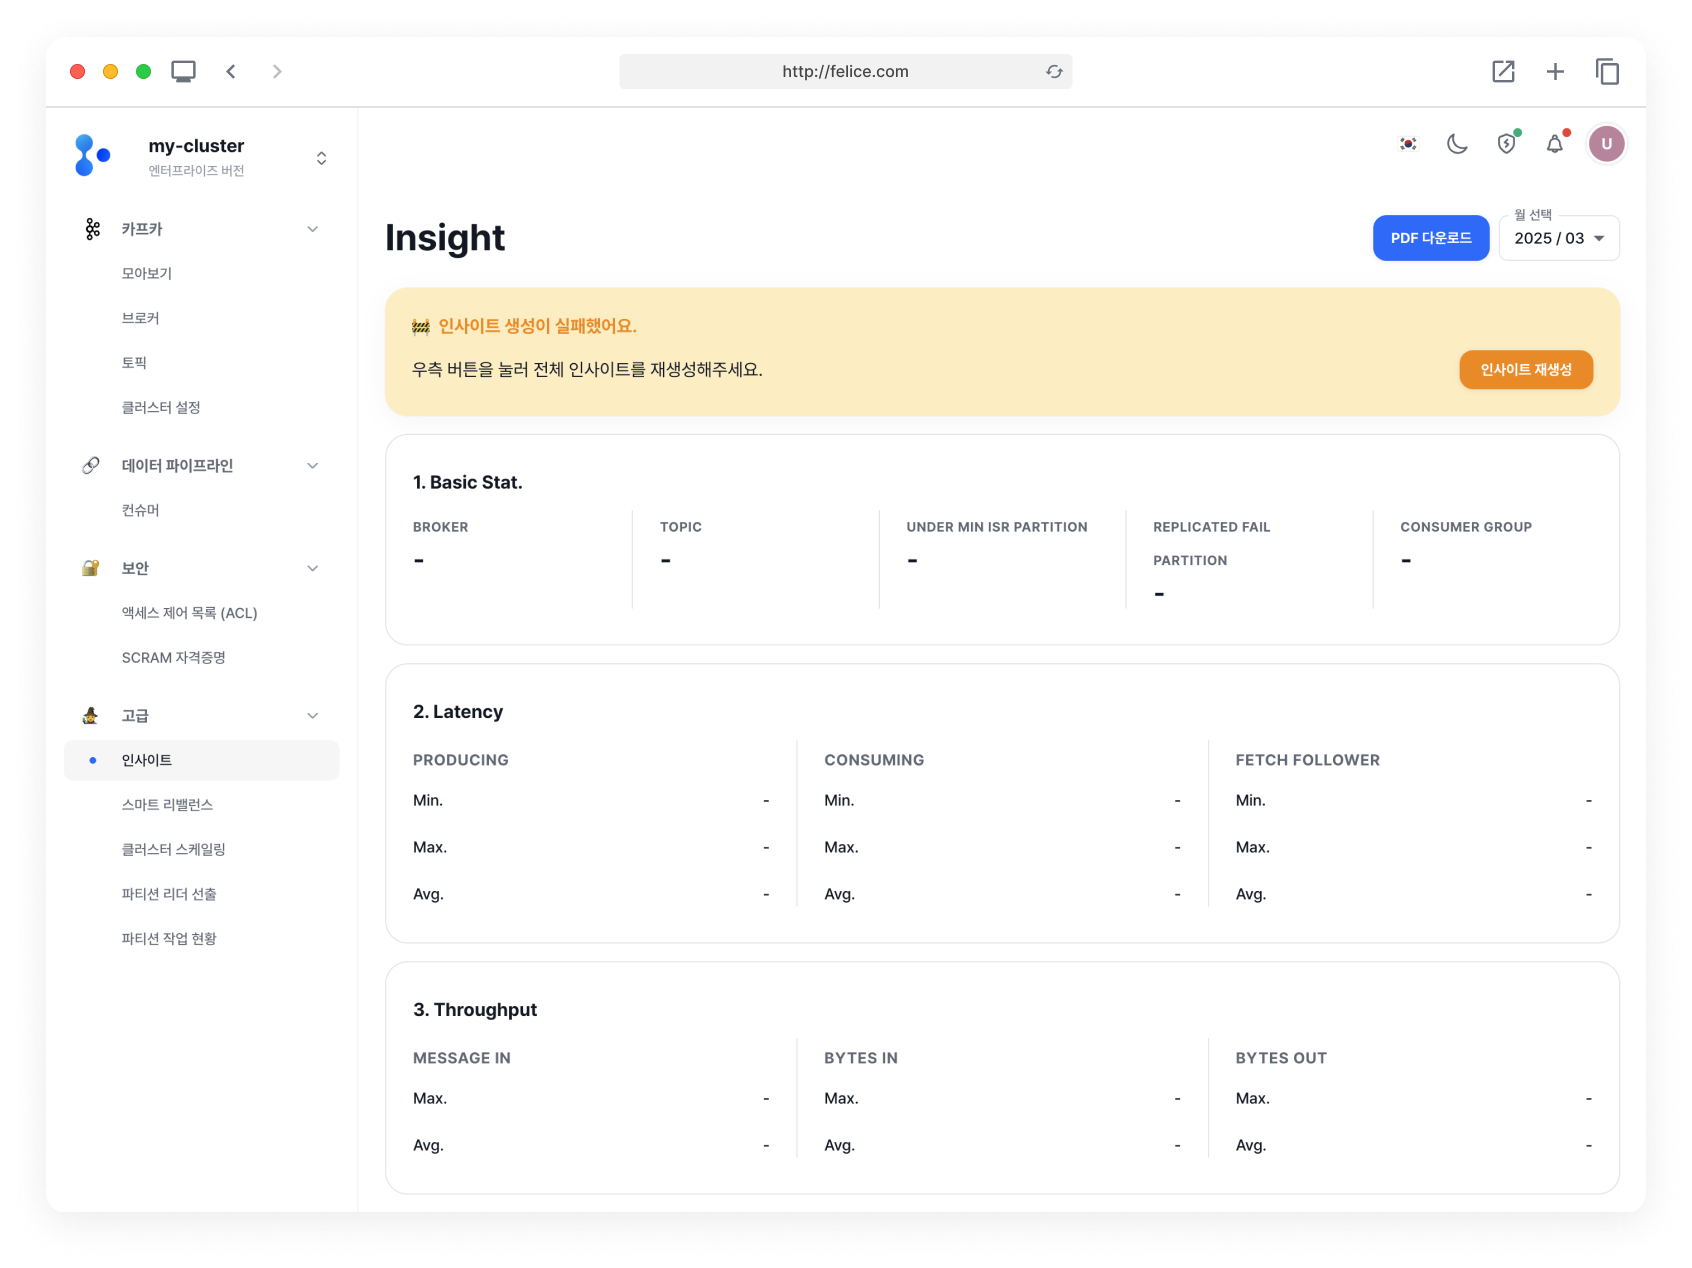
In this section, you can check which items failed to generate properly and click the [Regenerate Insight] button to reprocess them.
PDF Download
Click the [Download PDF] button to download the generated insights as a PDF. The more data there is, the longer the PDF extraction may take.
Monthly Insight Lookup
Click the [Select Month] dropdown to view insights for a specific month. You can look back up to one year.
Only months with generated insights can be selected, except for the current (in-progress) month.
Insight Details
If there is no data saved for the previous month, changes and growth rates may not be visible.
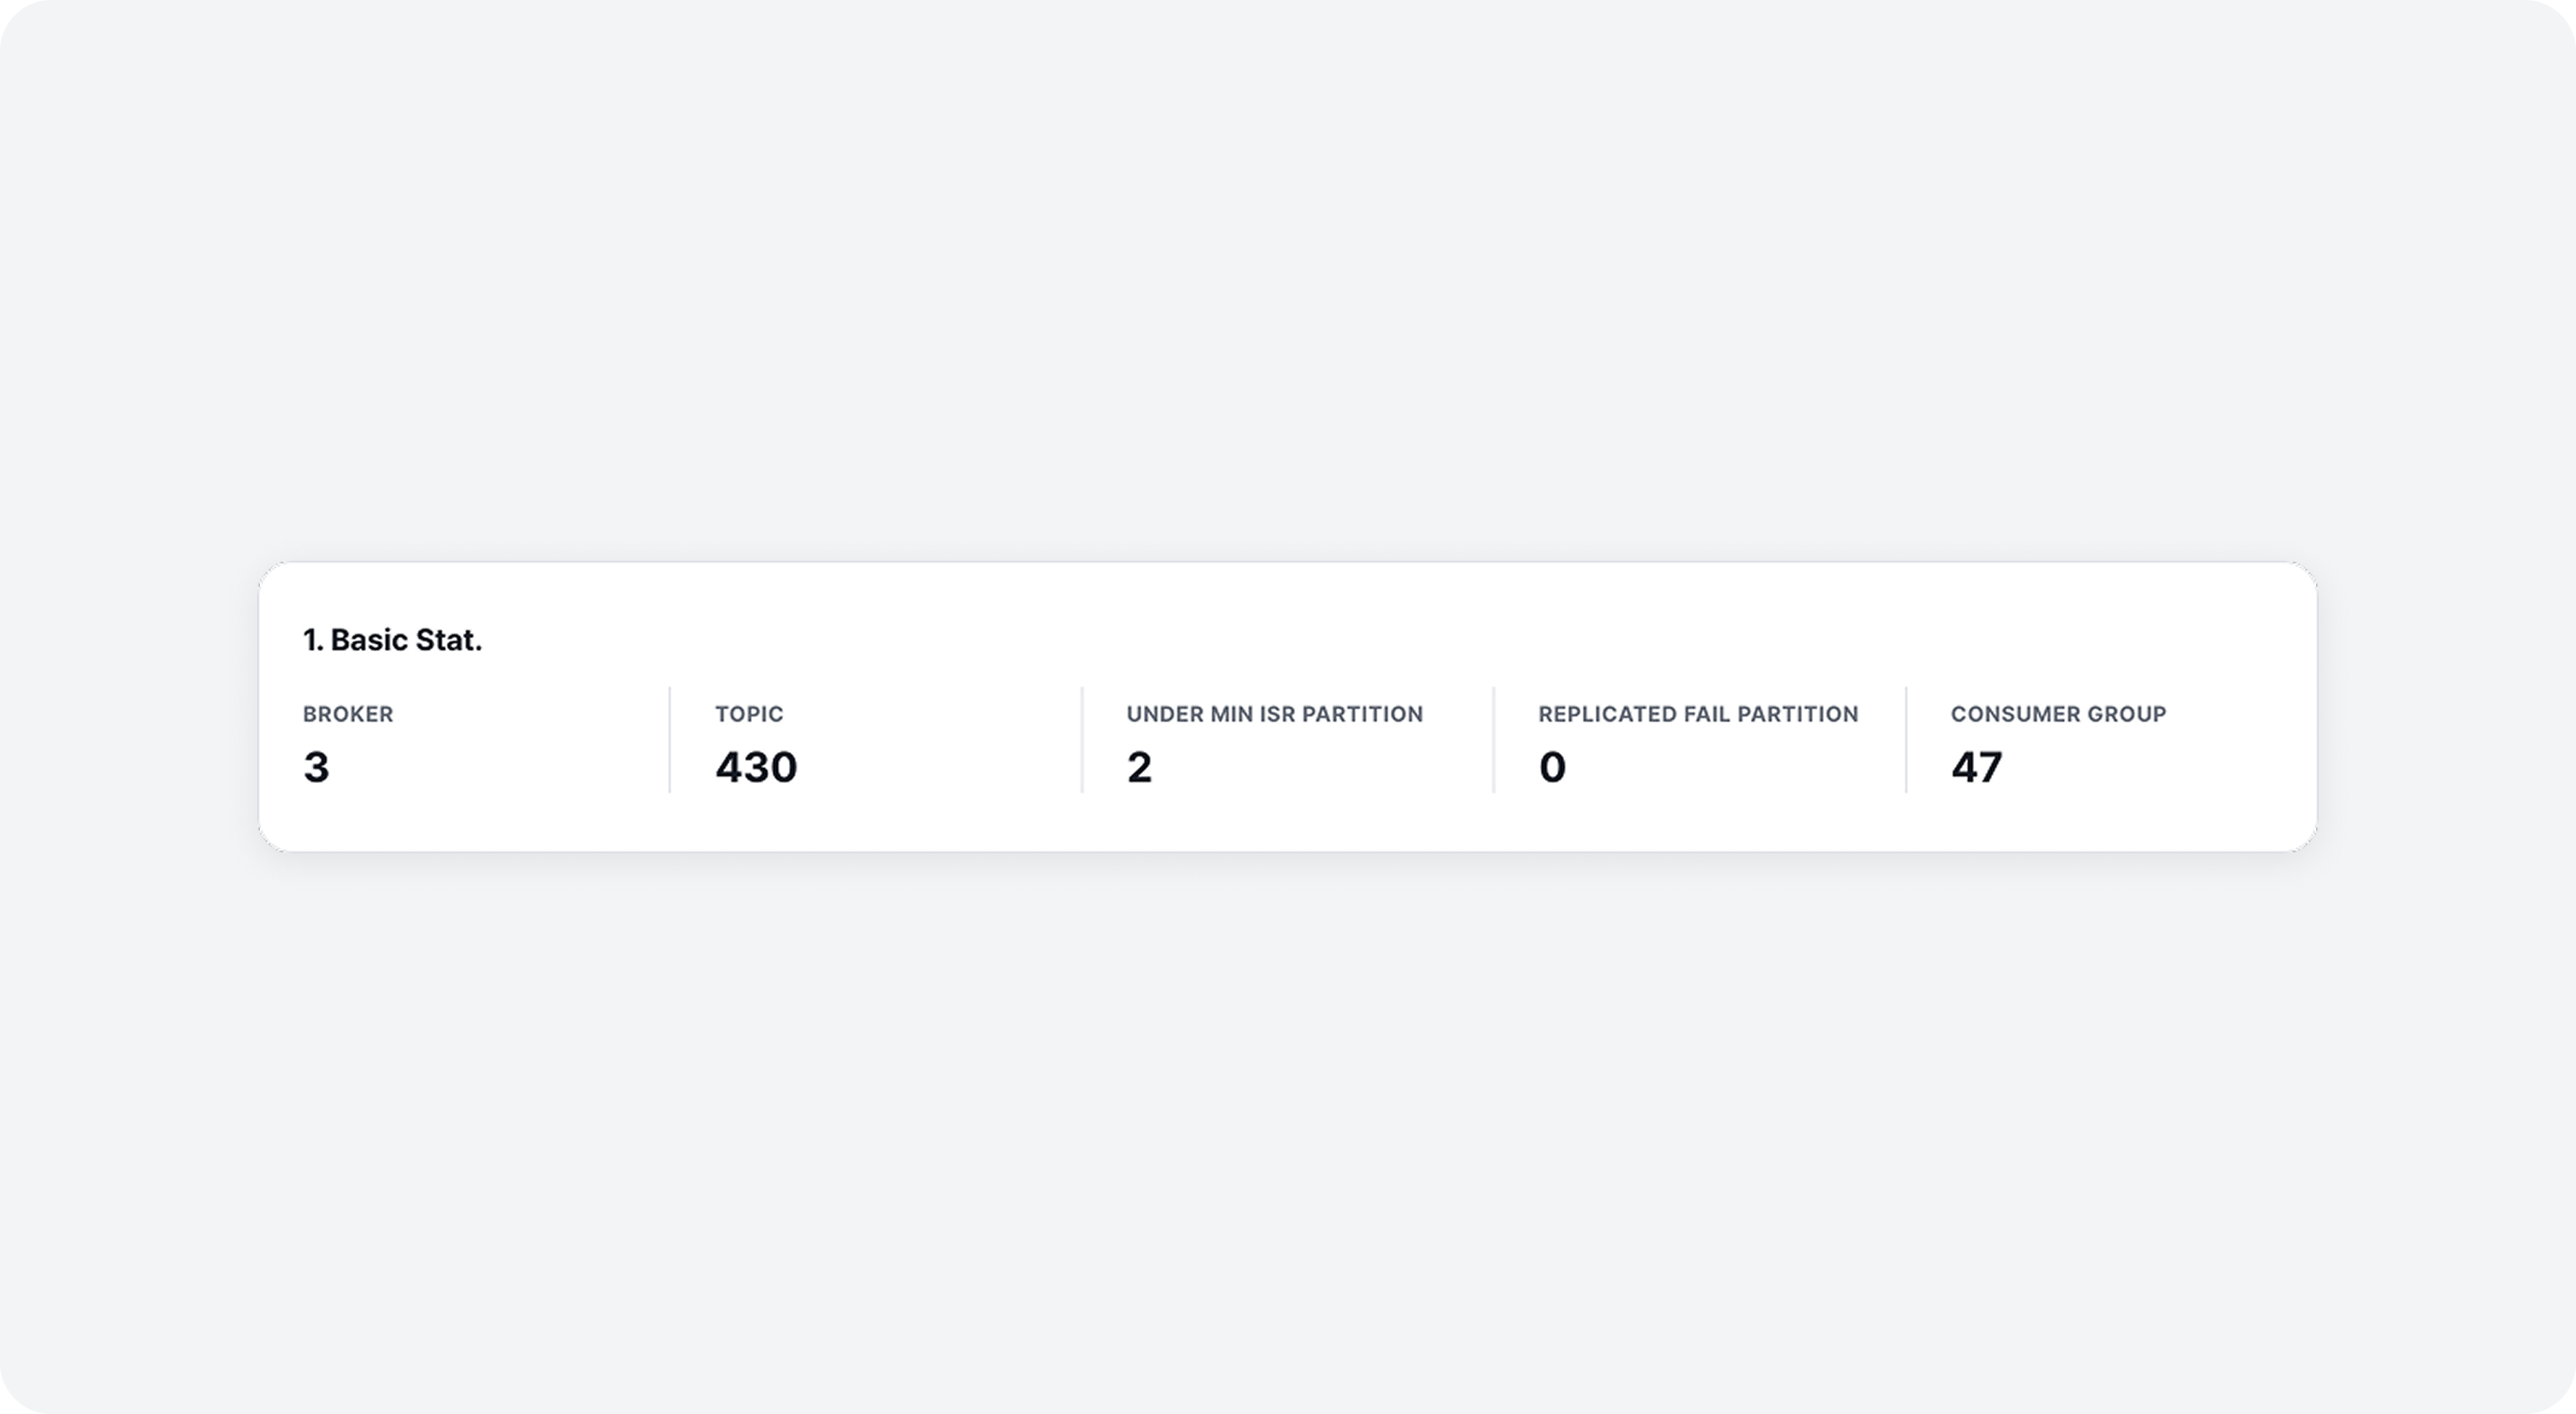
Basic Stat.
Aggregated resource metrics for the month.
| Category | Description |
|---|---|
| ⓵ Broker | Number of brokers and change from the previous month |
| ⓶ Topic | Number of topics and change from the previous month |
| ⓷ Under Min isr partition | Partitions below min ISR and change from the previous month |
| ⓸ Replicated fail partition | Number of failed replication partitions and change |
| ⓹ Consumer group | Number of consumer groups and change from the previous month |
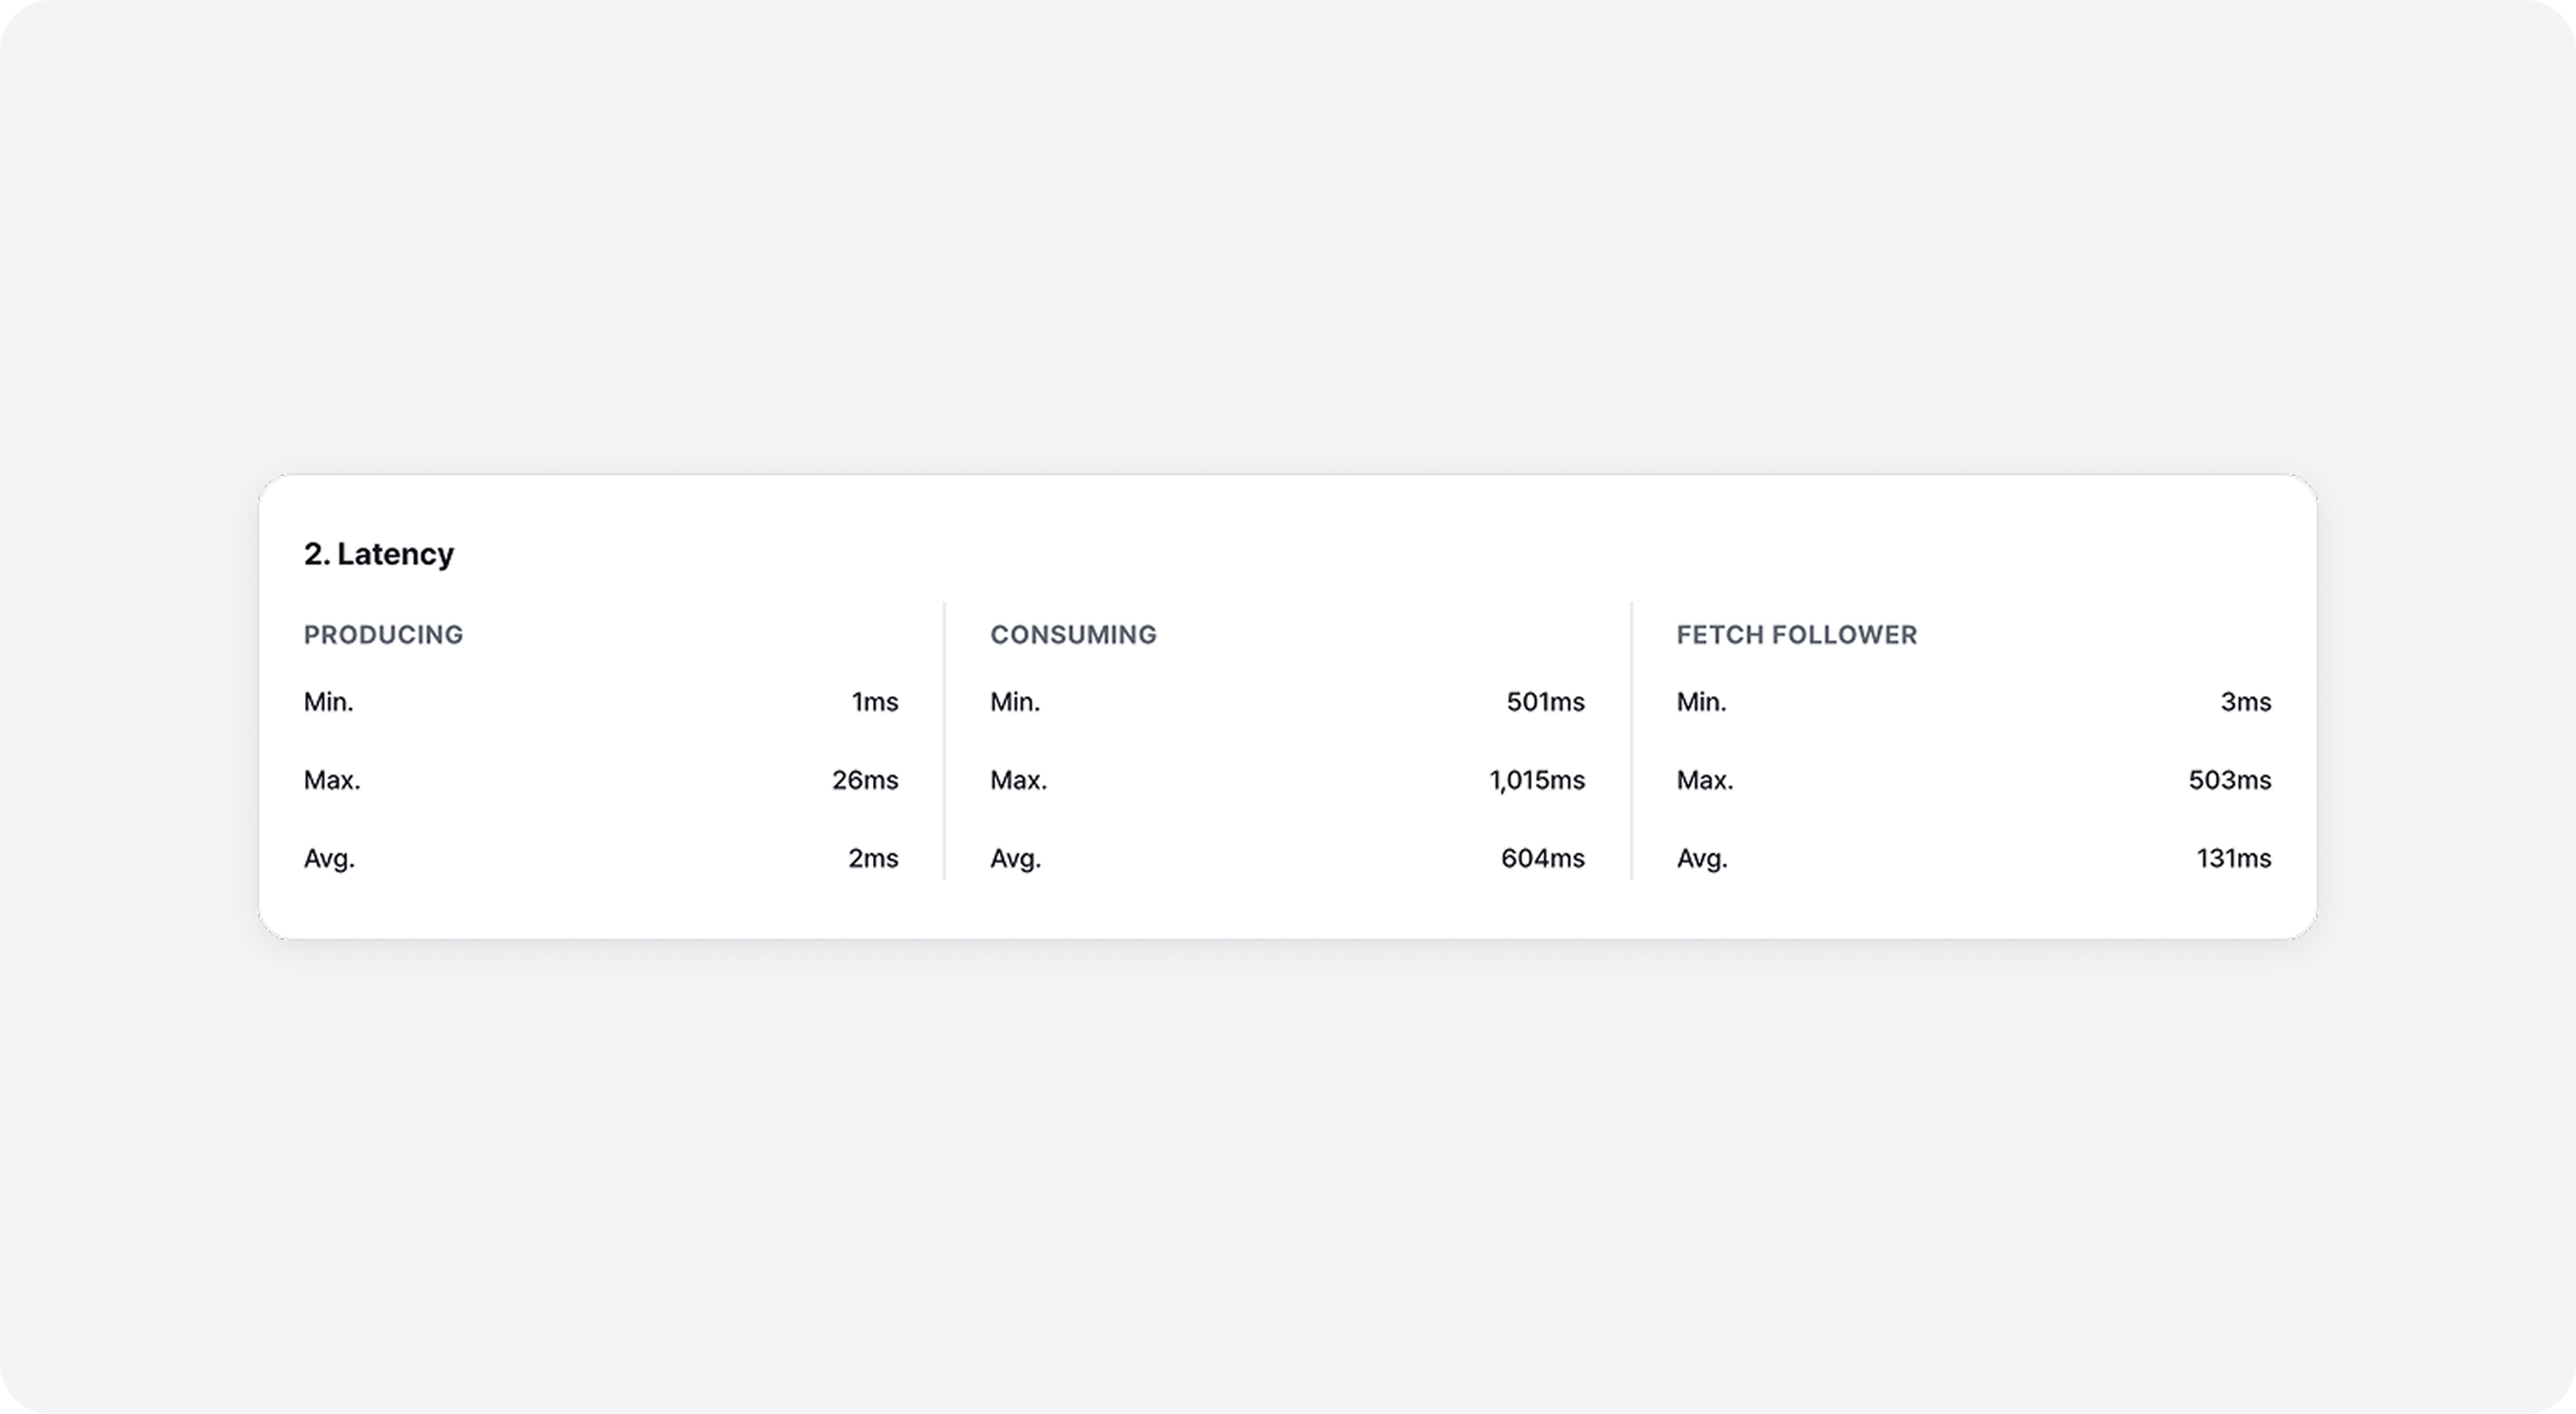
Latency
Latency data from the cluster over the past month.
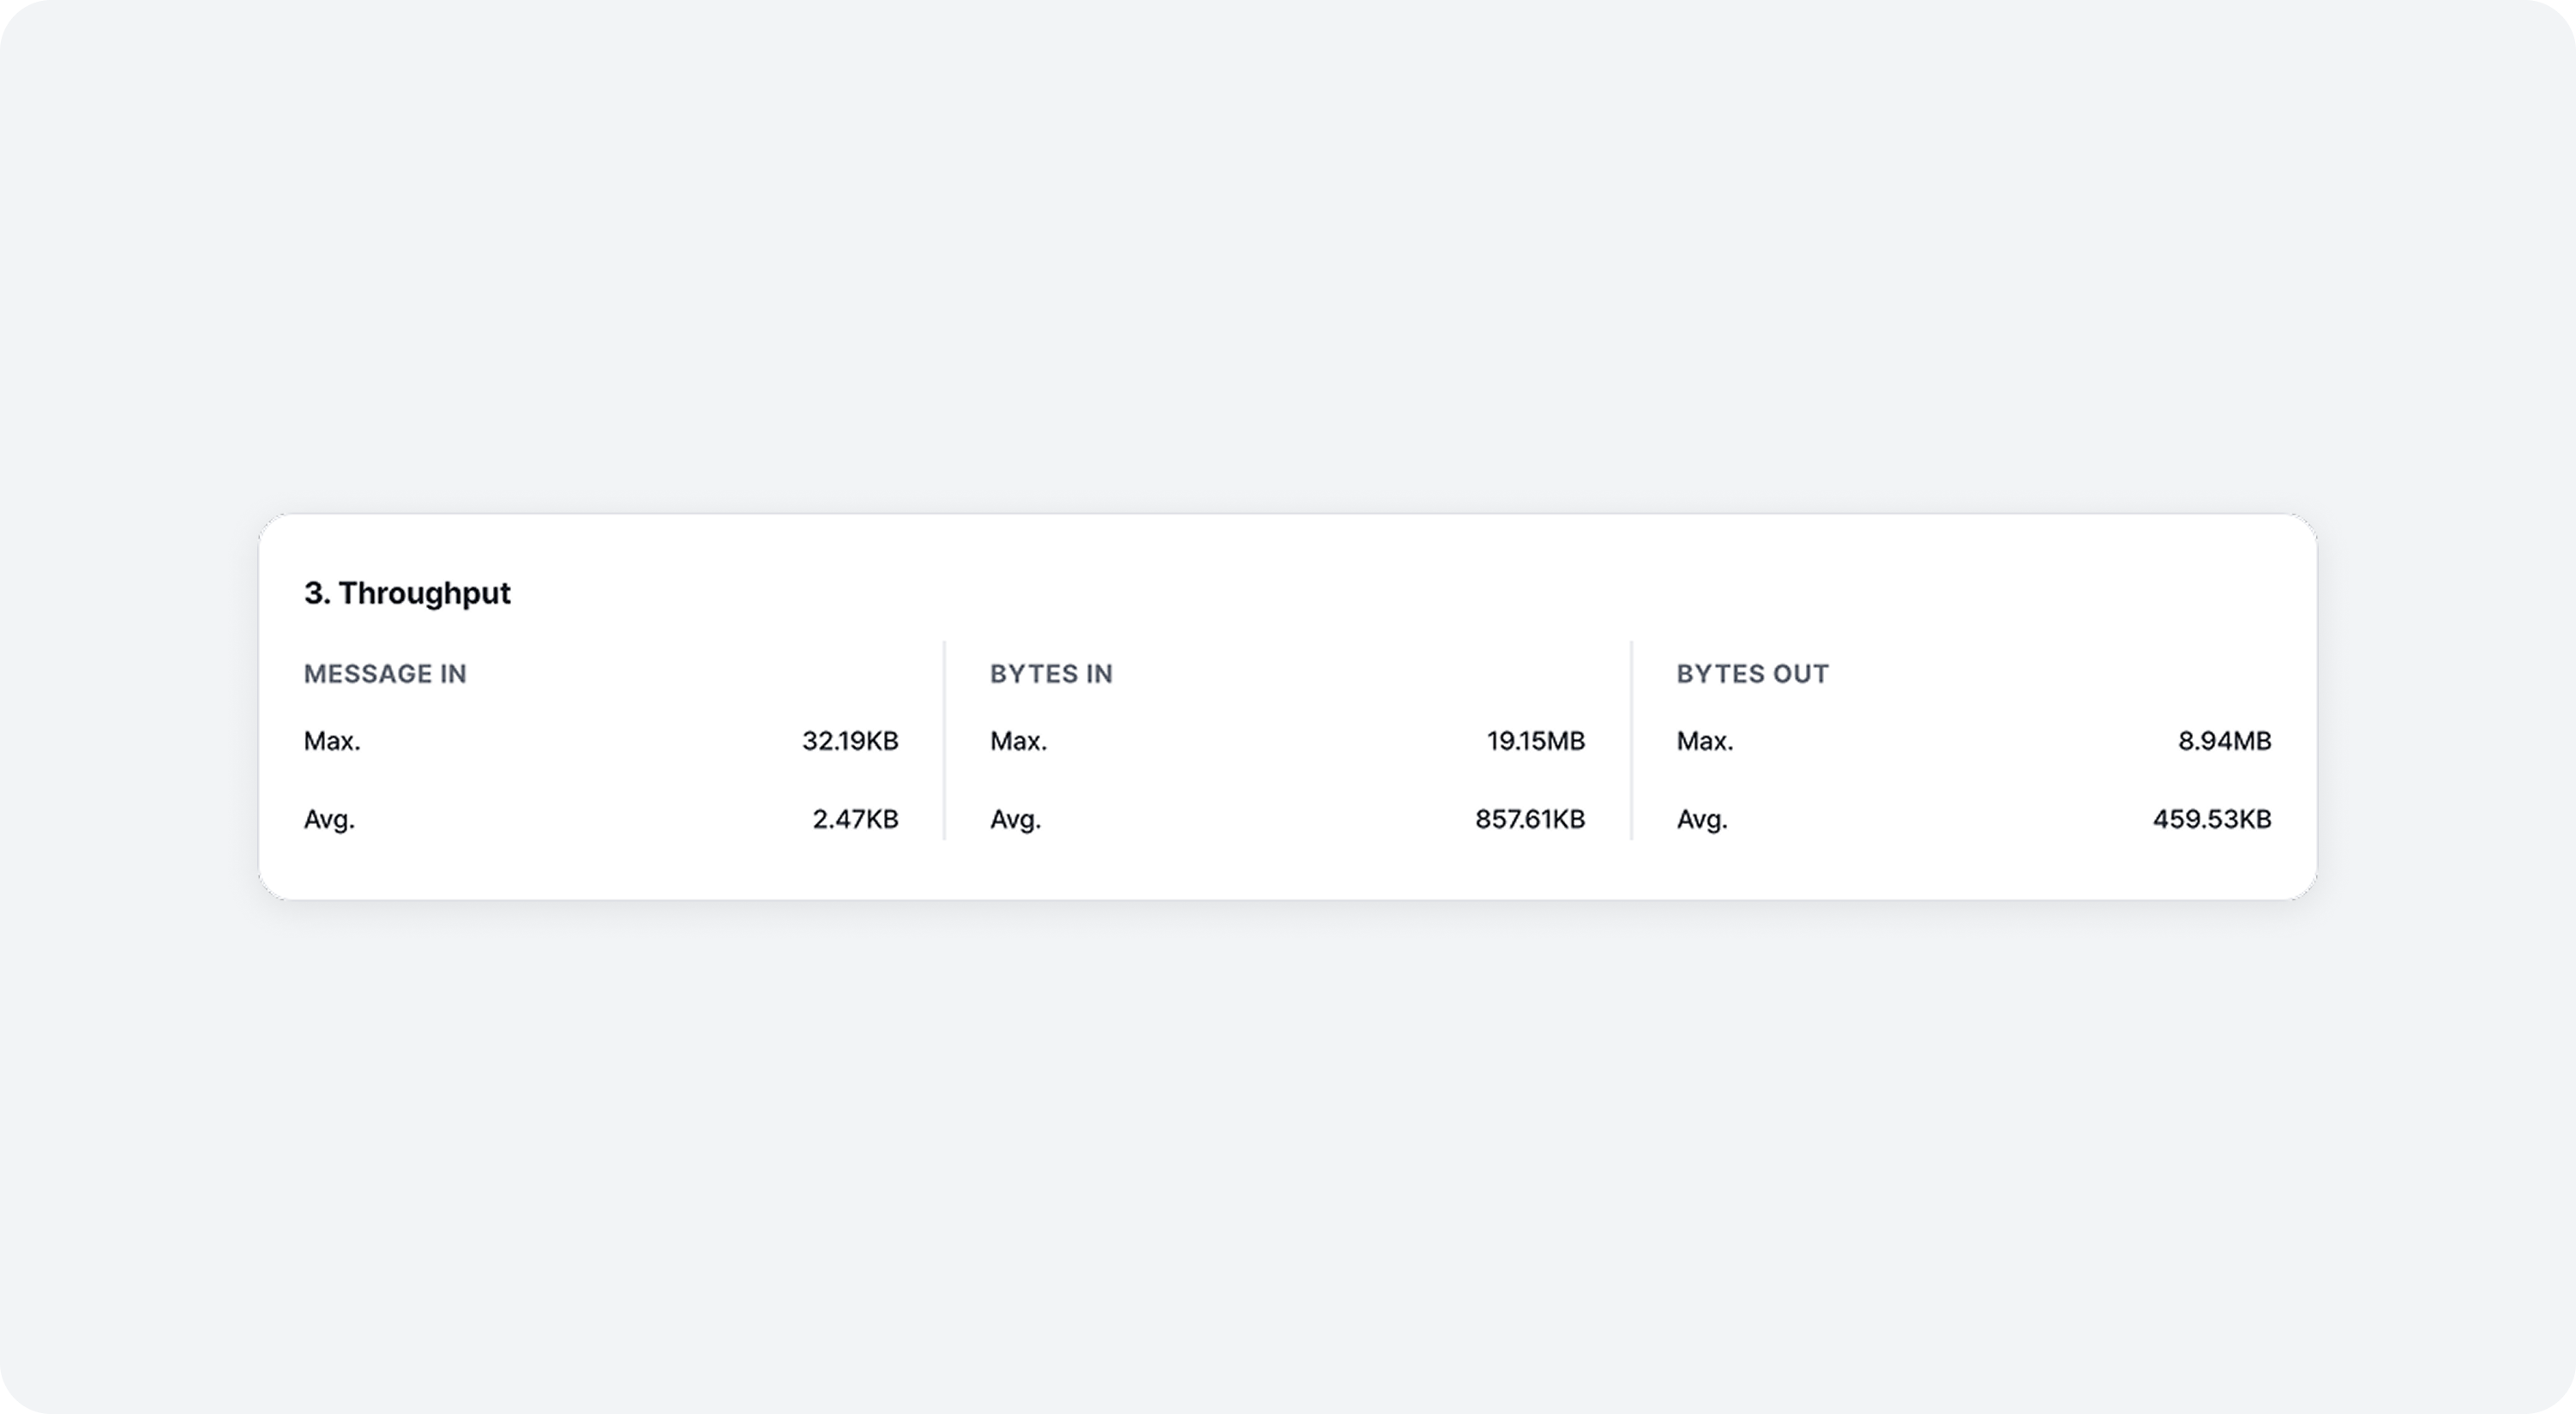
Throughput
Throughput data from the cluster over the past month.
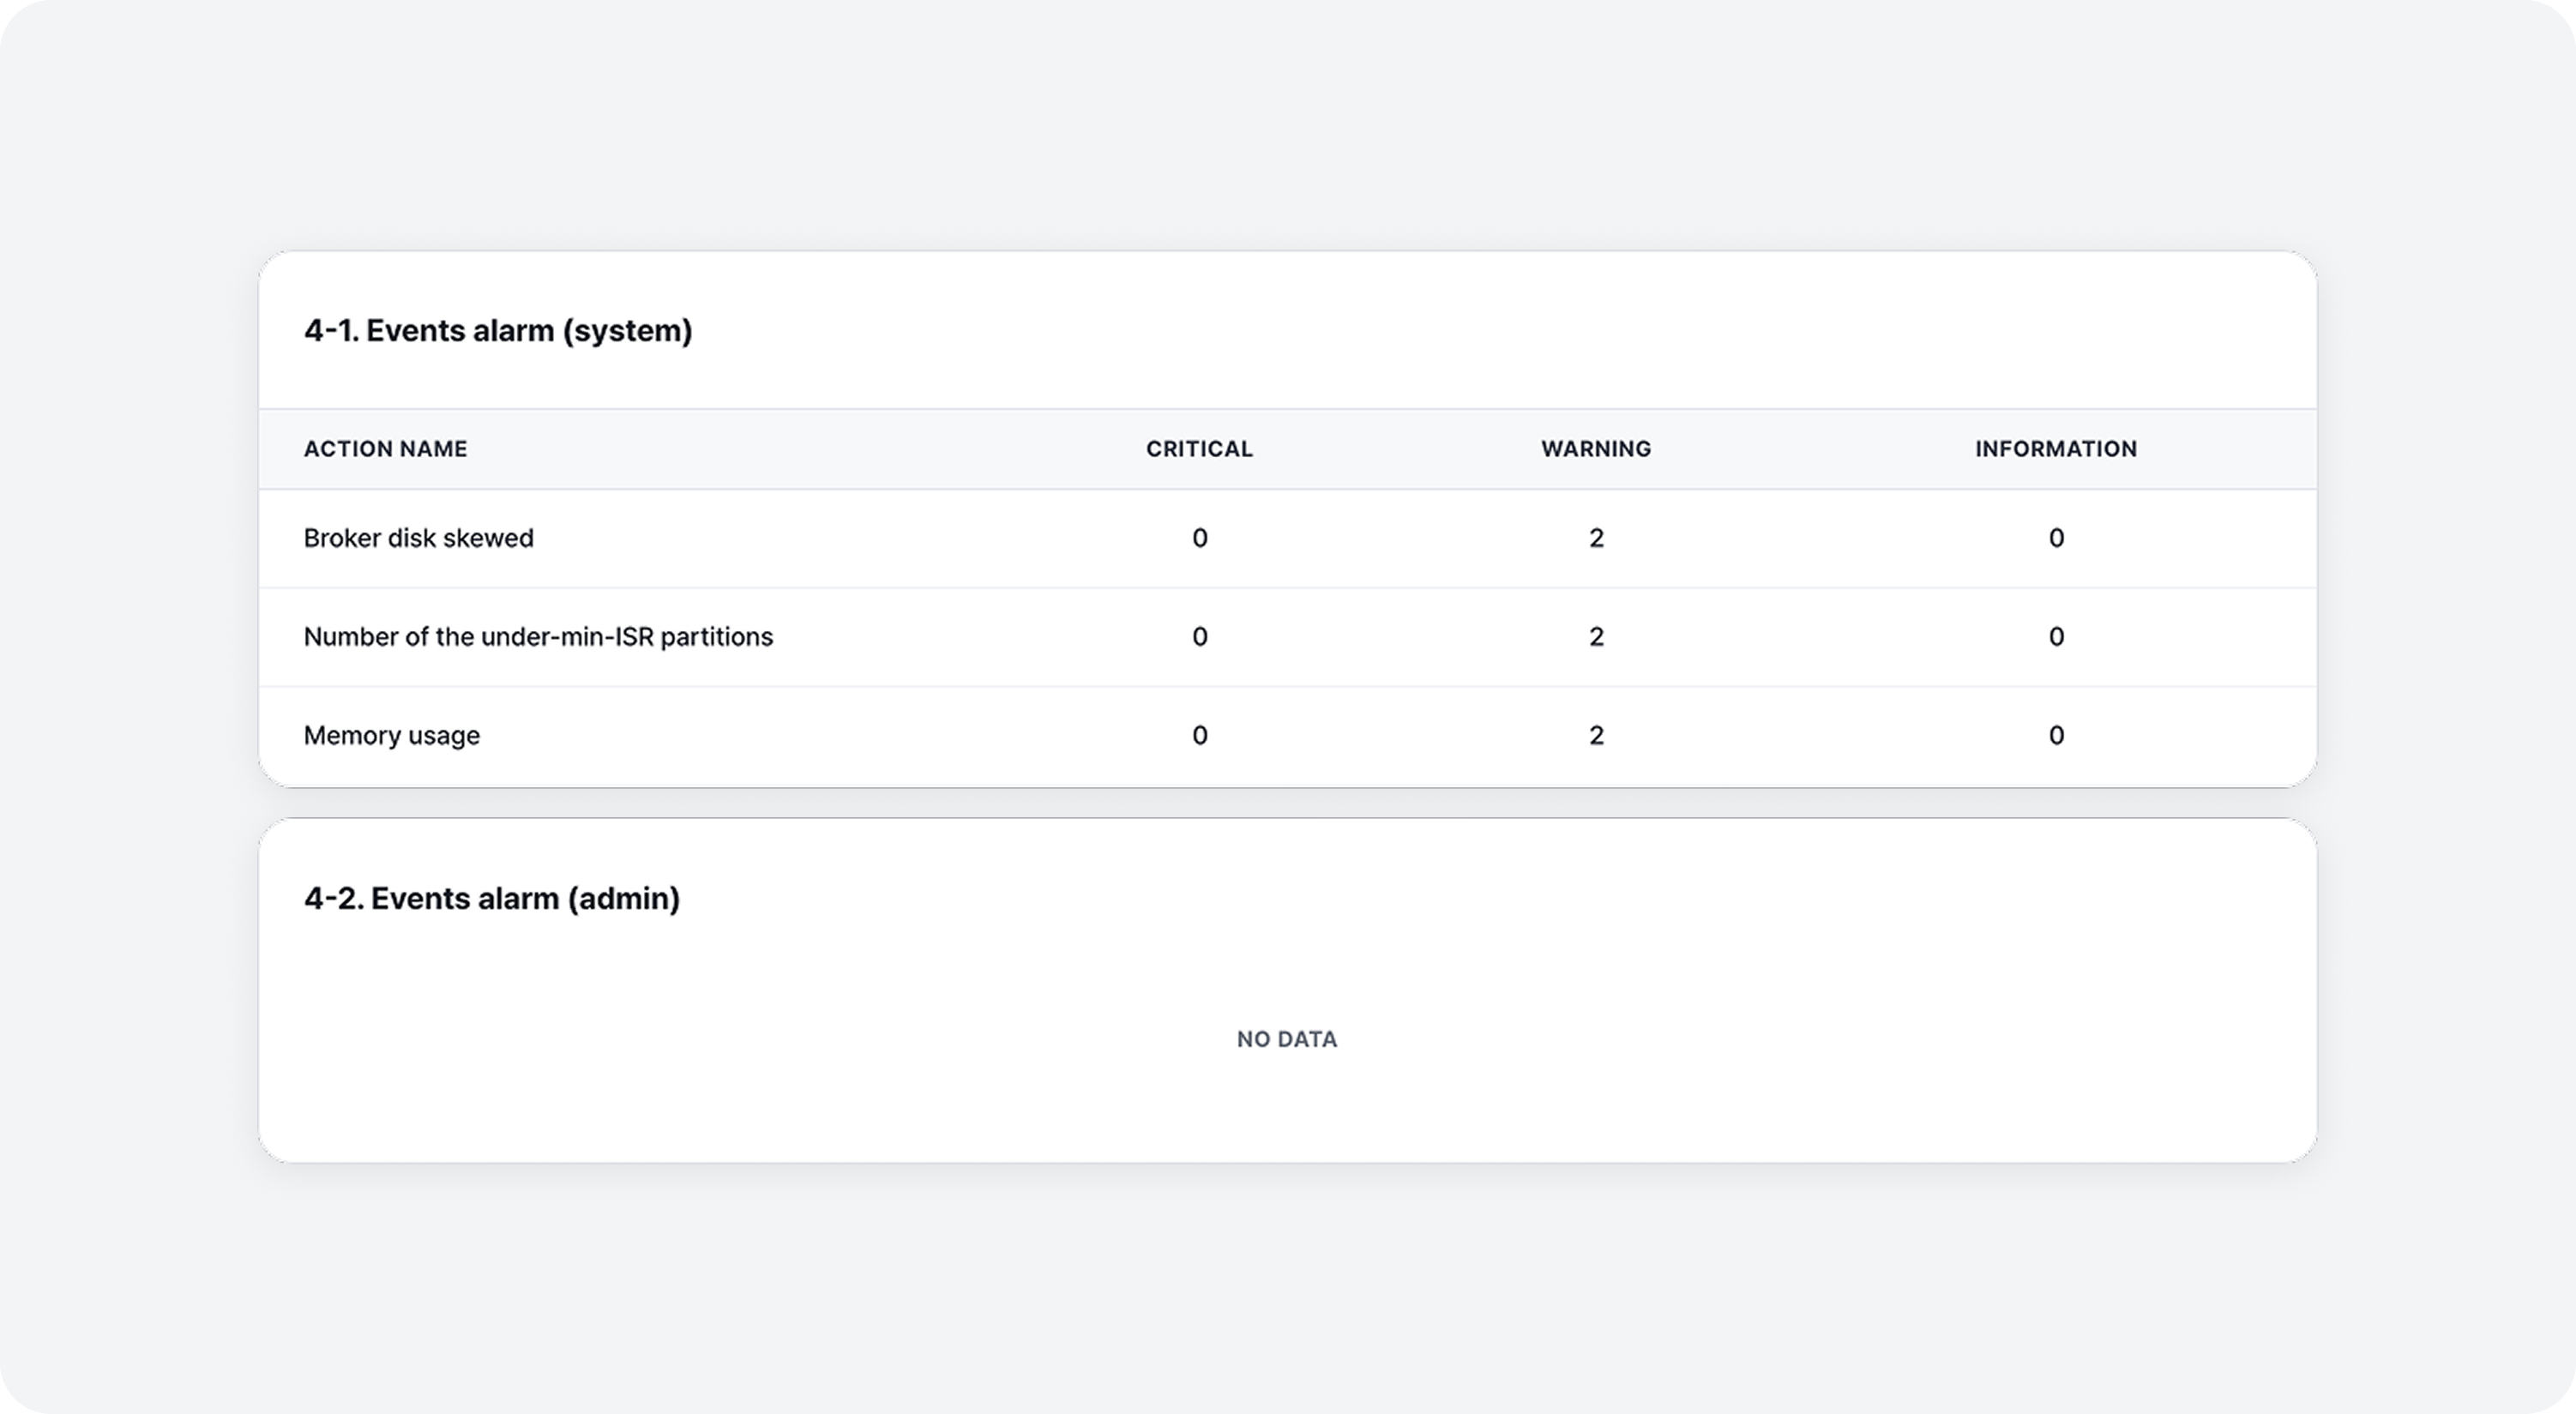
Events Alarm (System & Admin)
Aggregated alert counts registered in Felice over the past month. Includes both system and admin alerts.
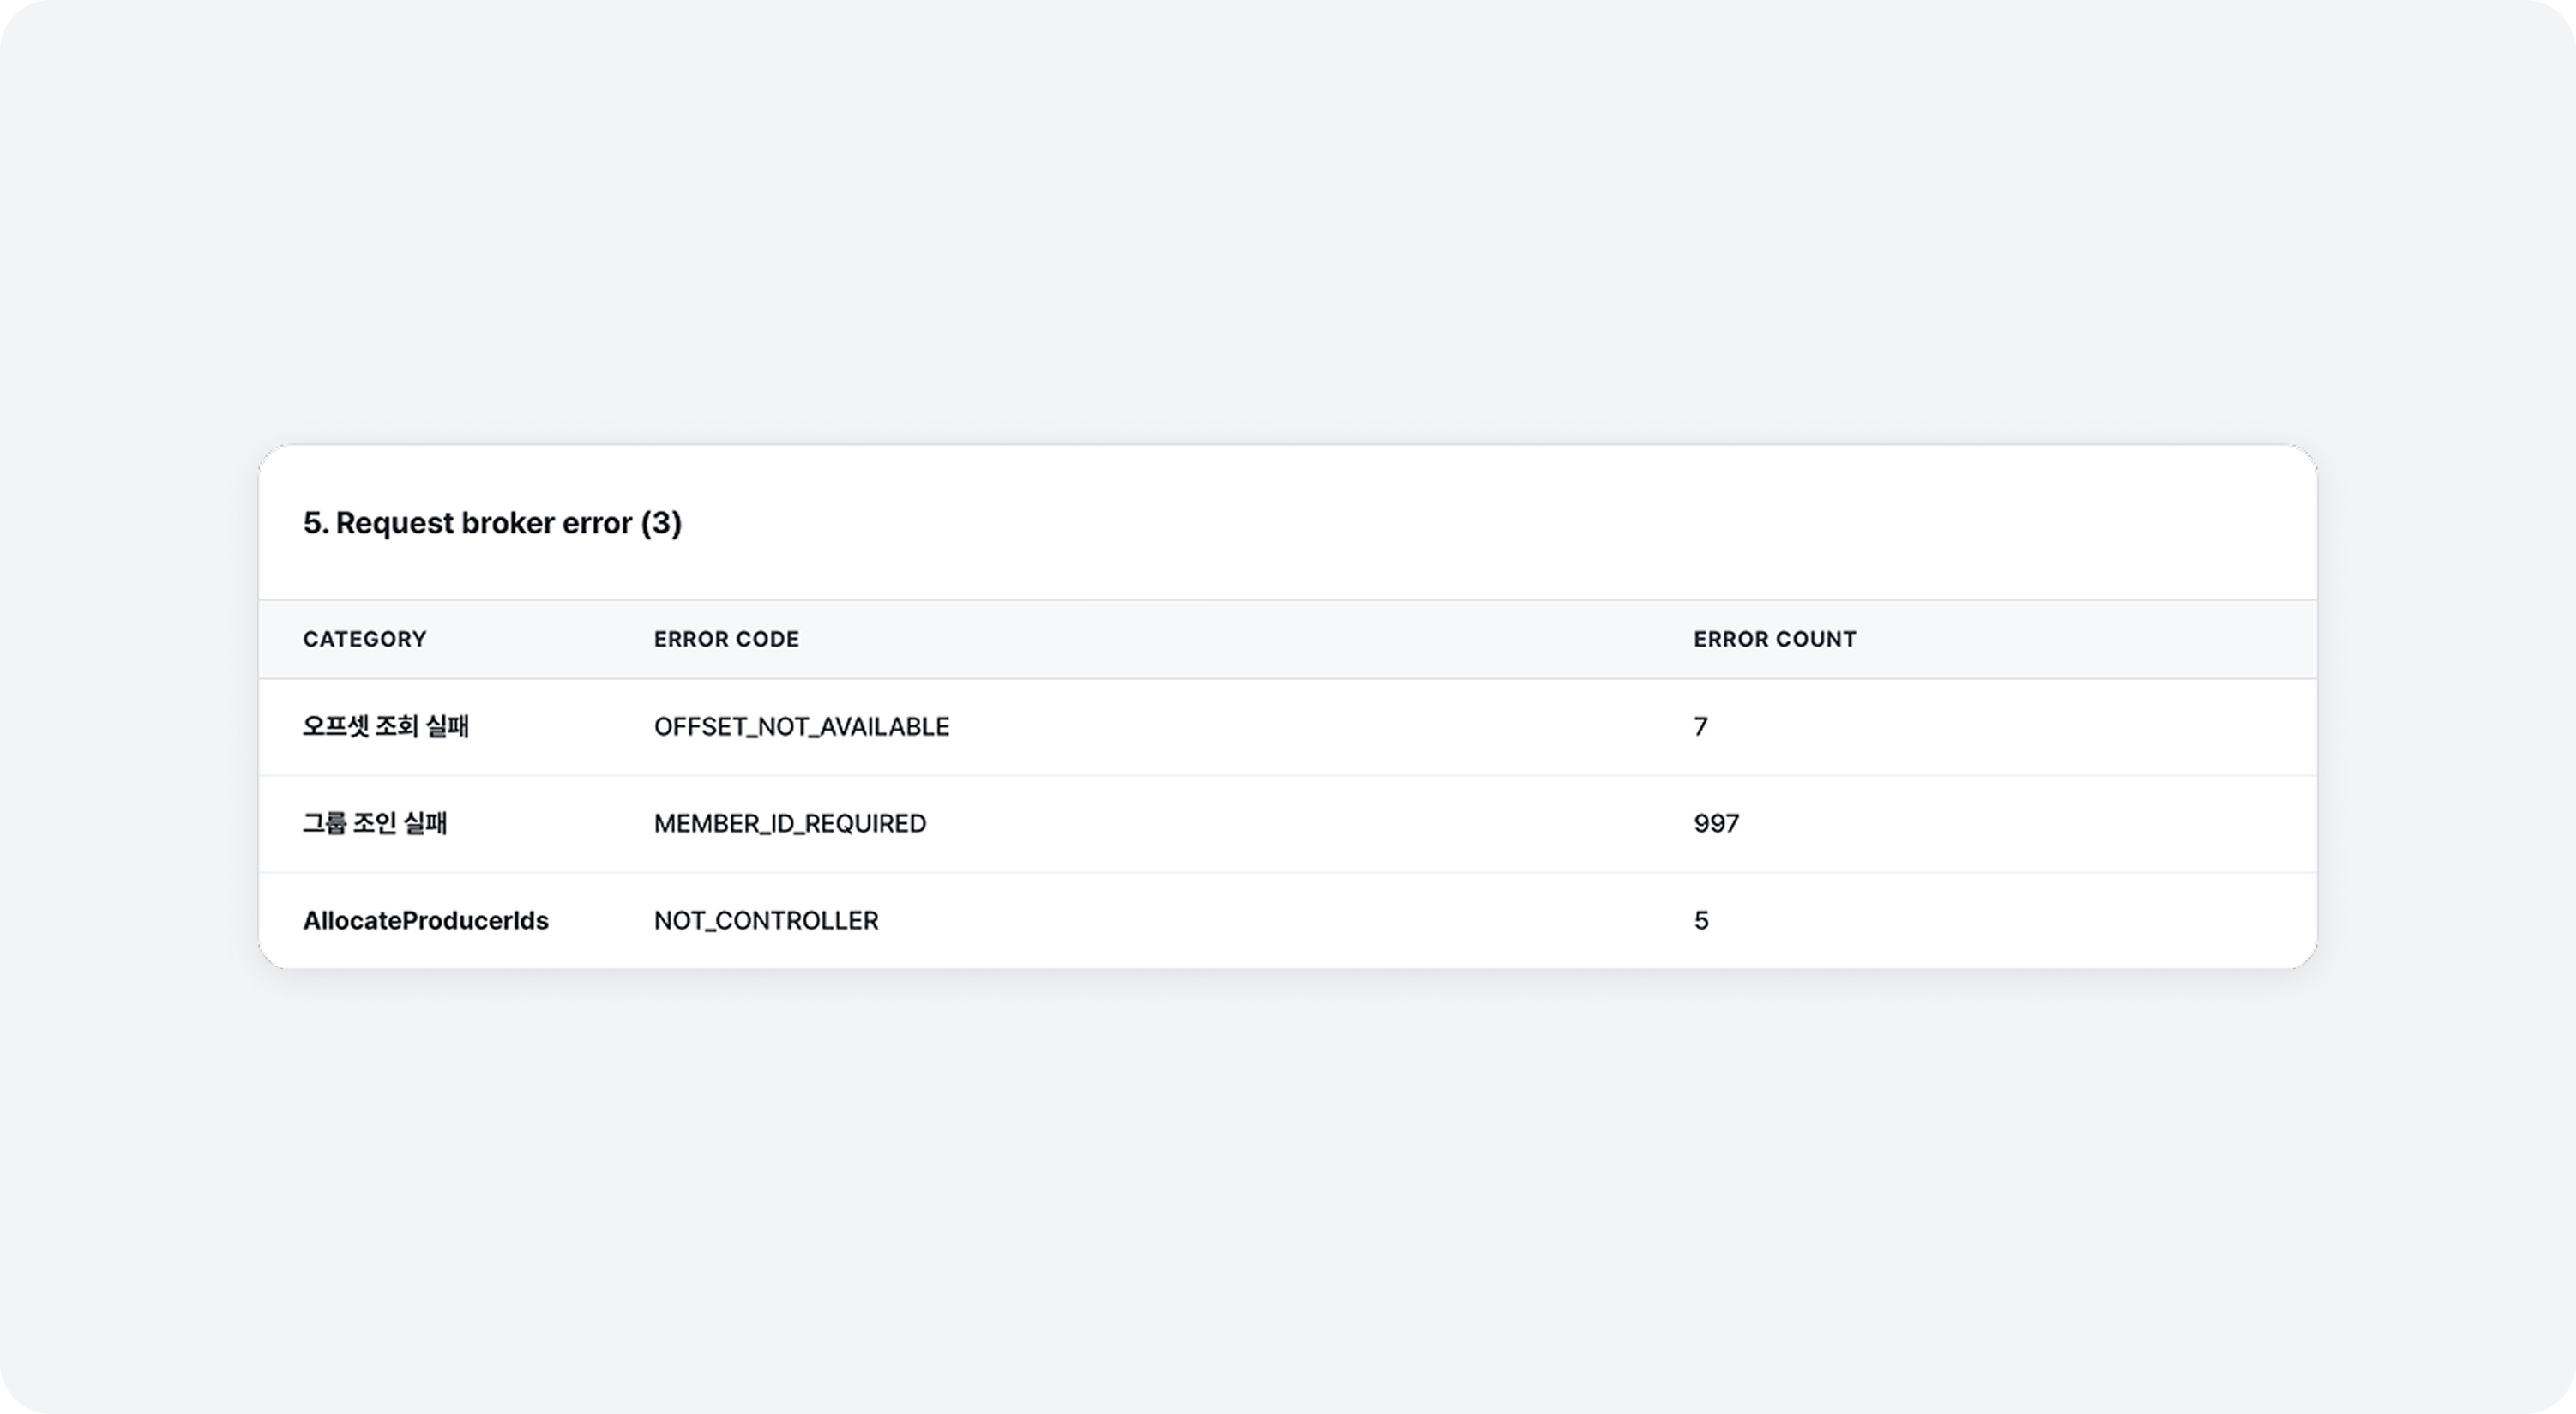
Request Broker Error
Aggregated errors from broker requests. Hover over an error code to see more details.
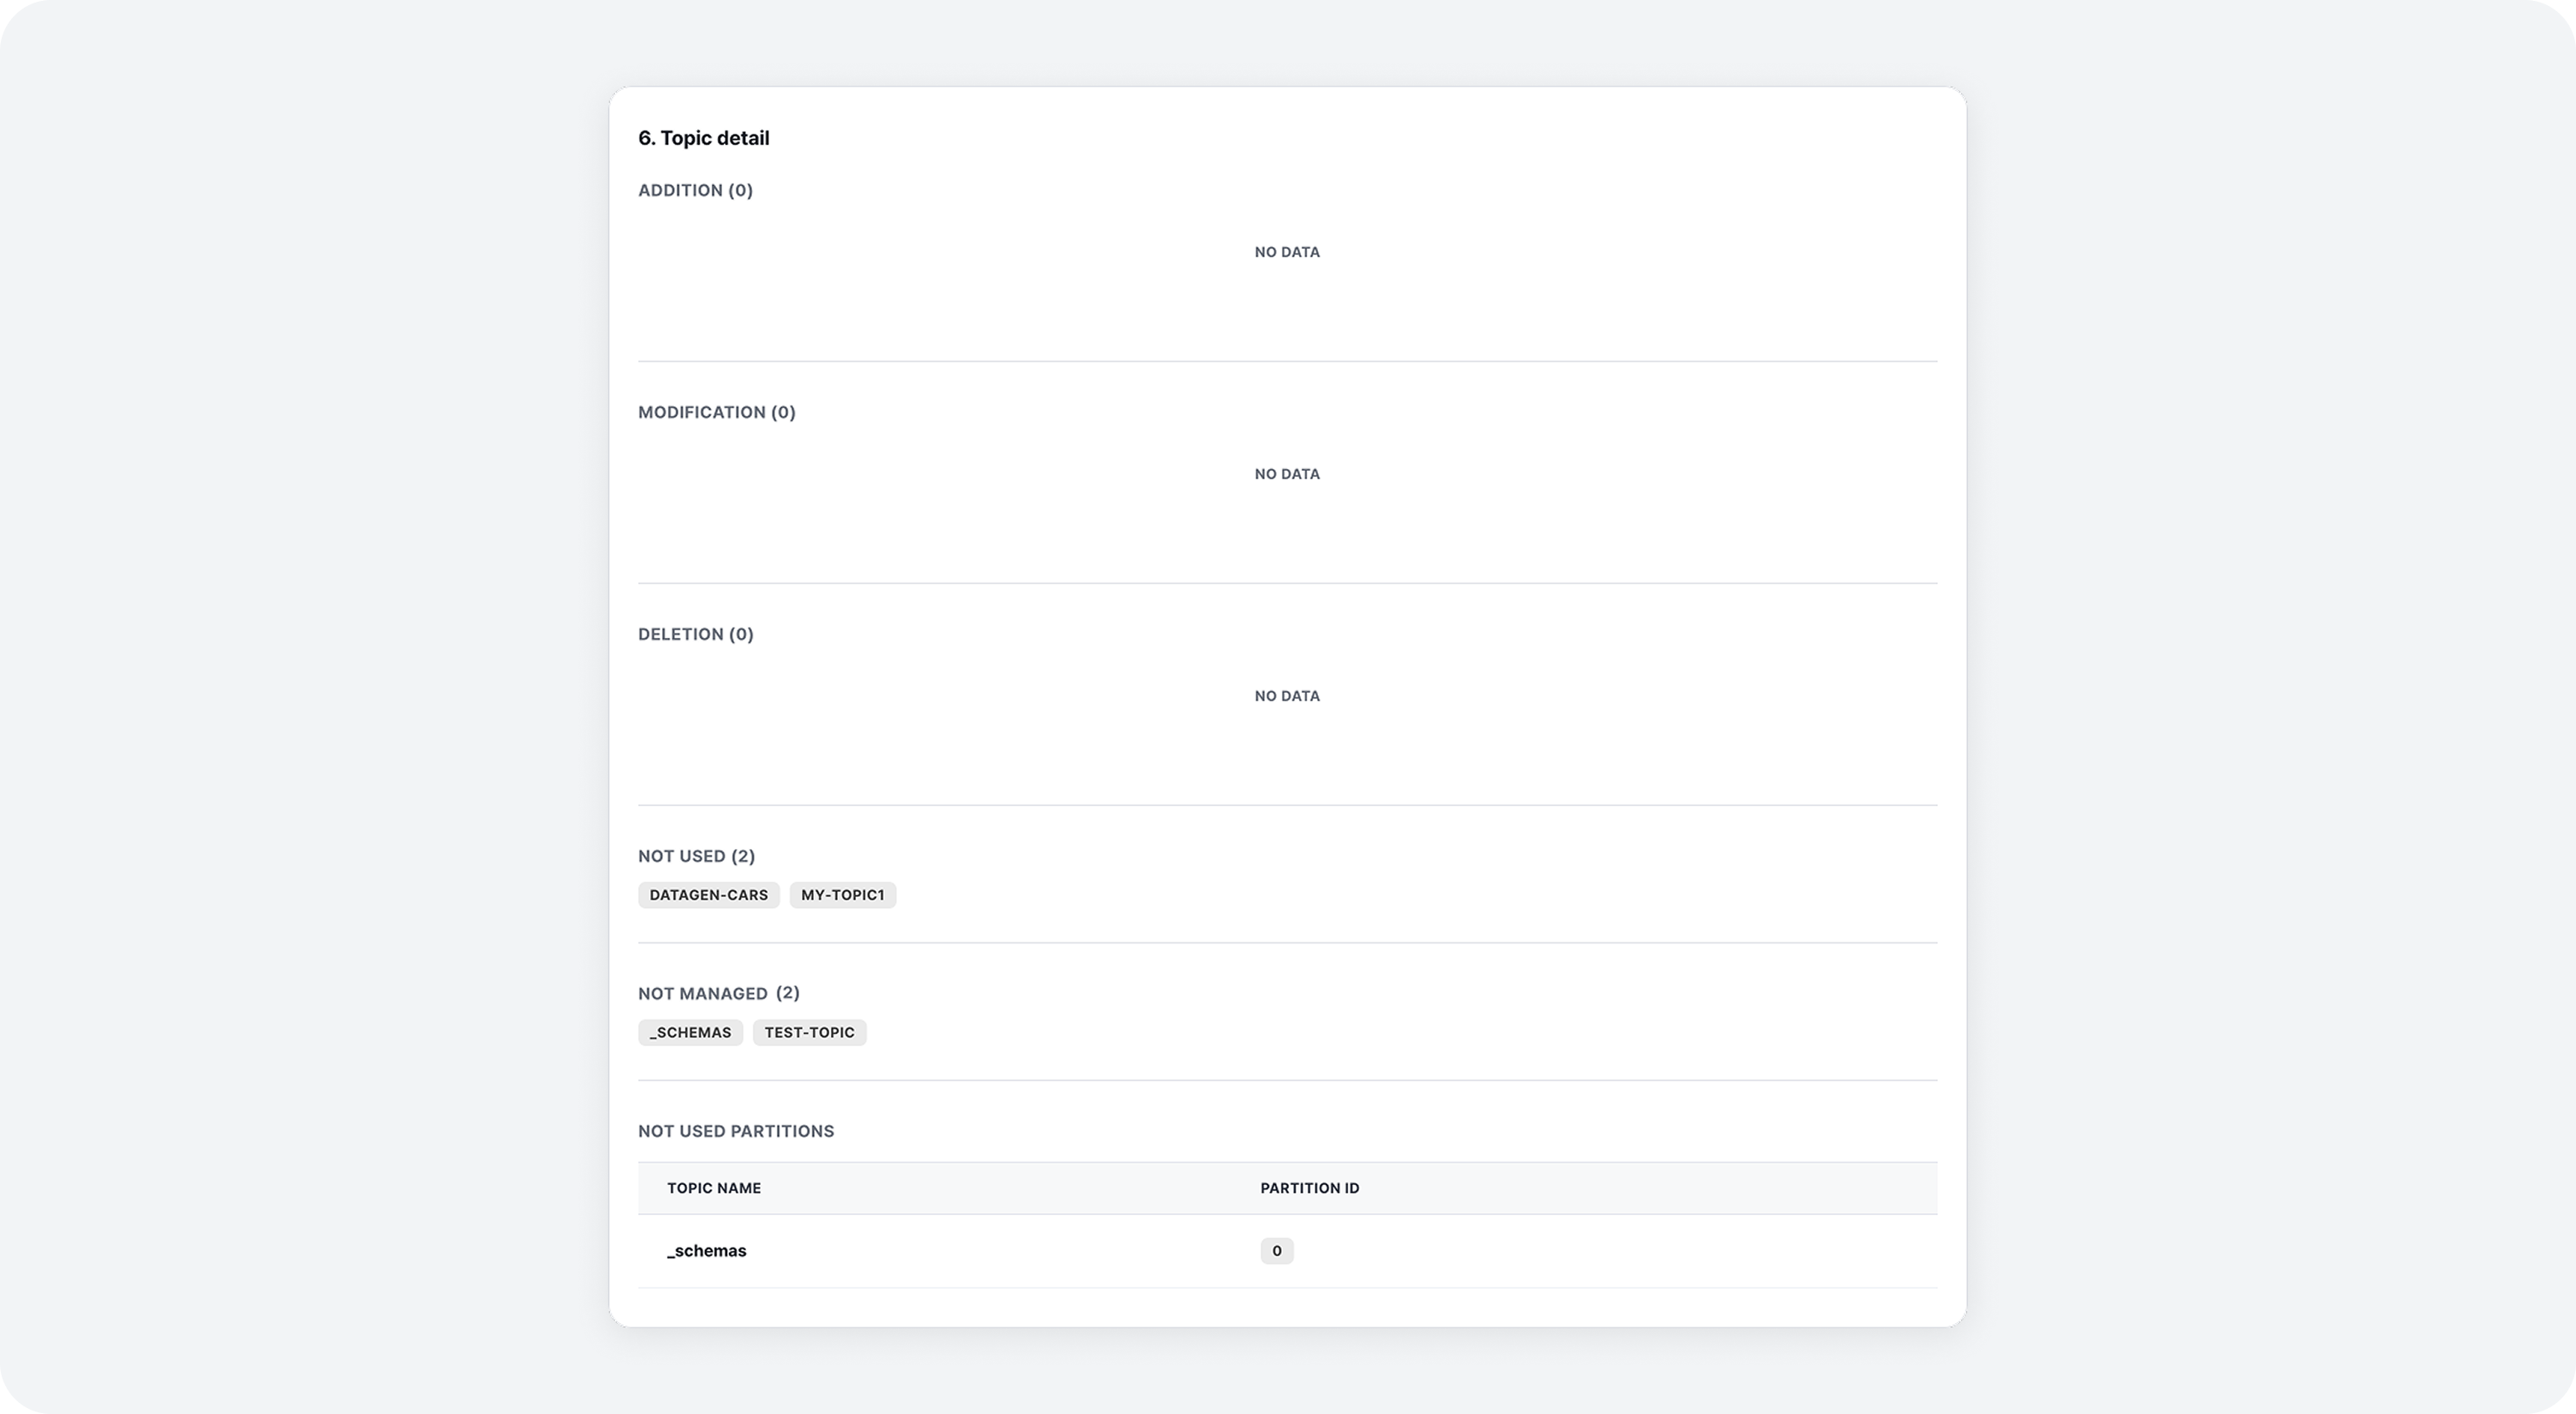
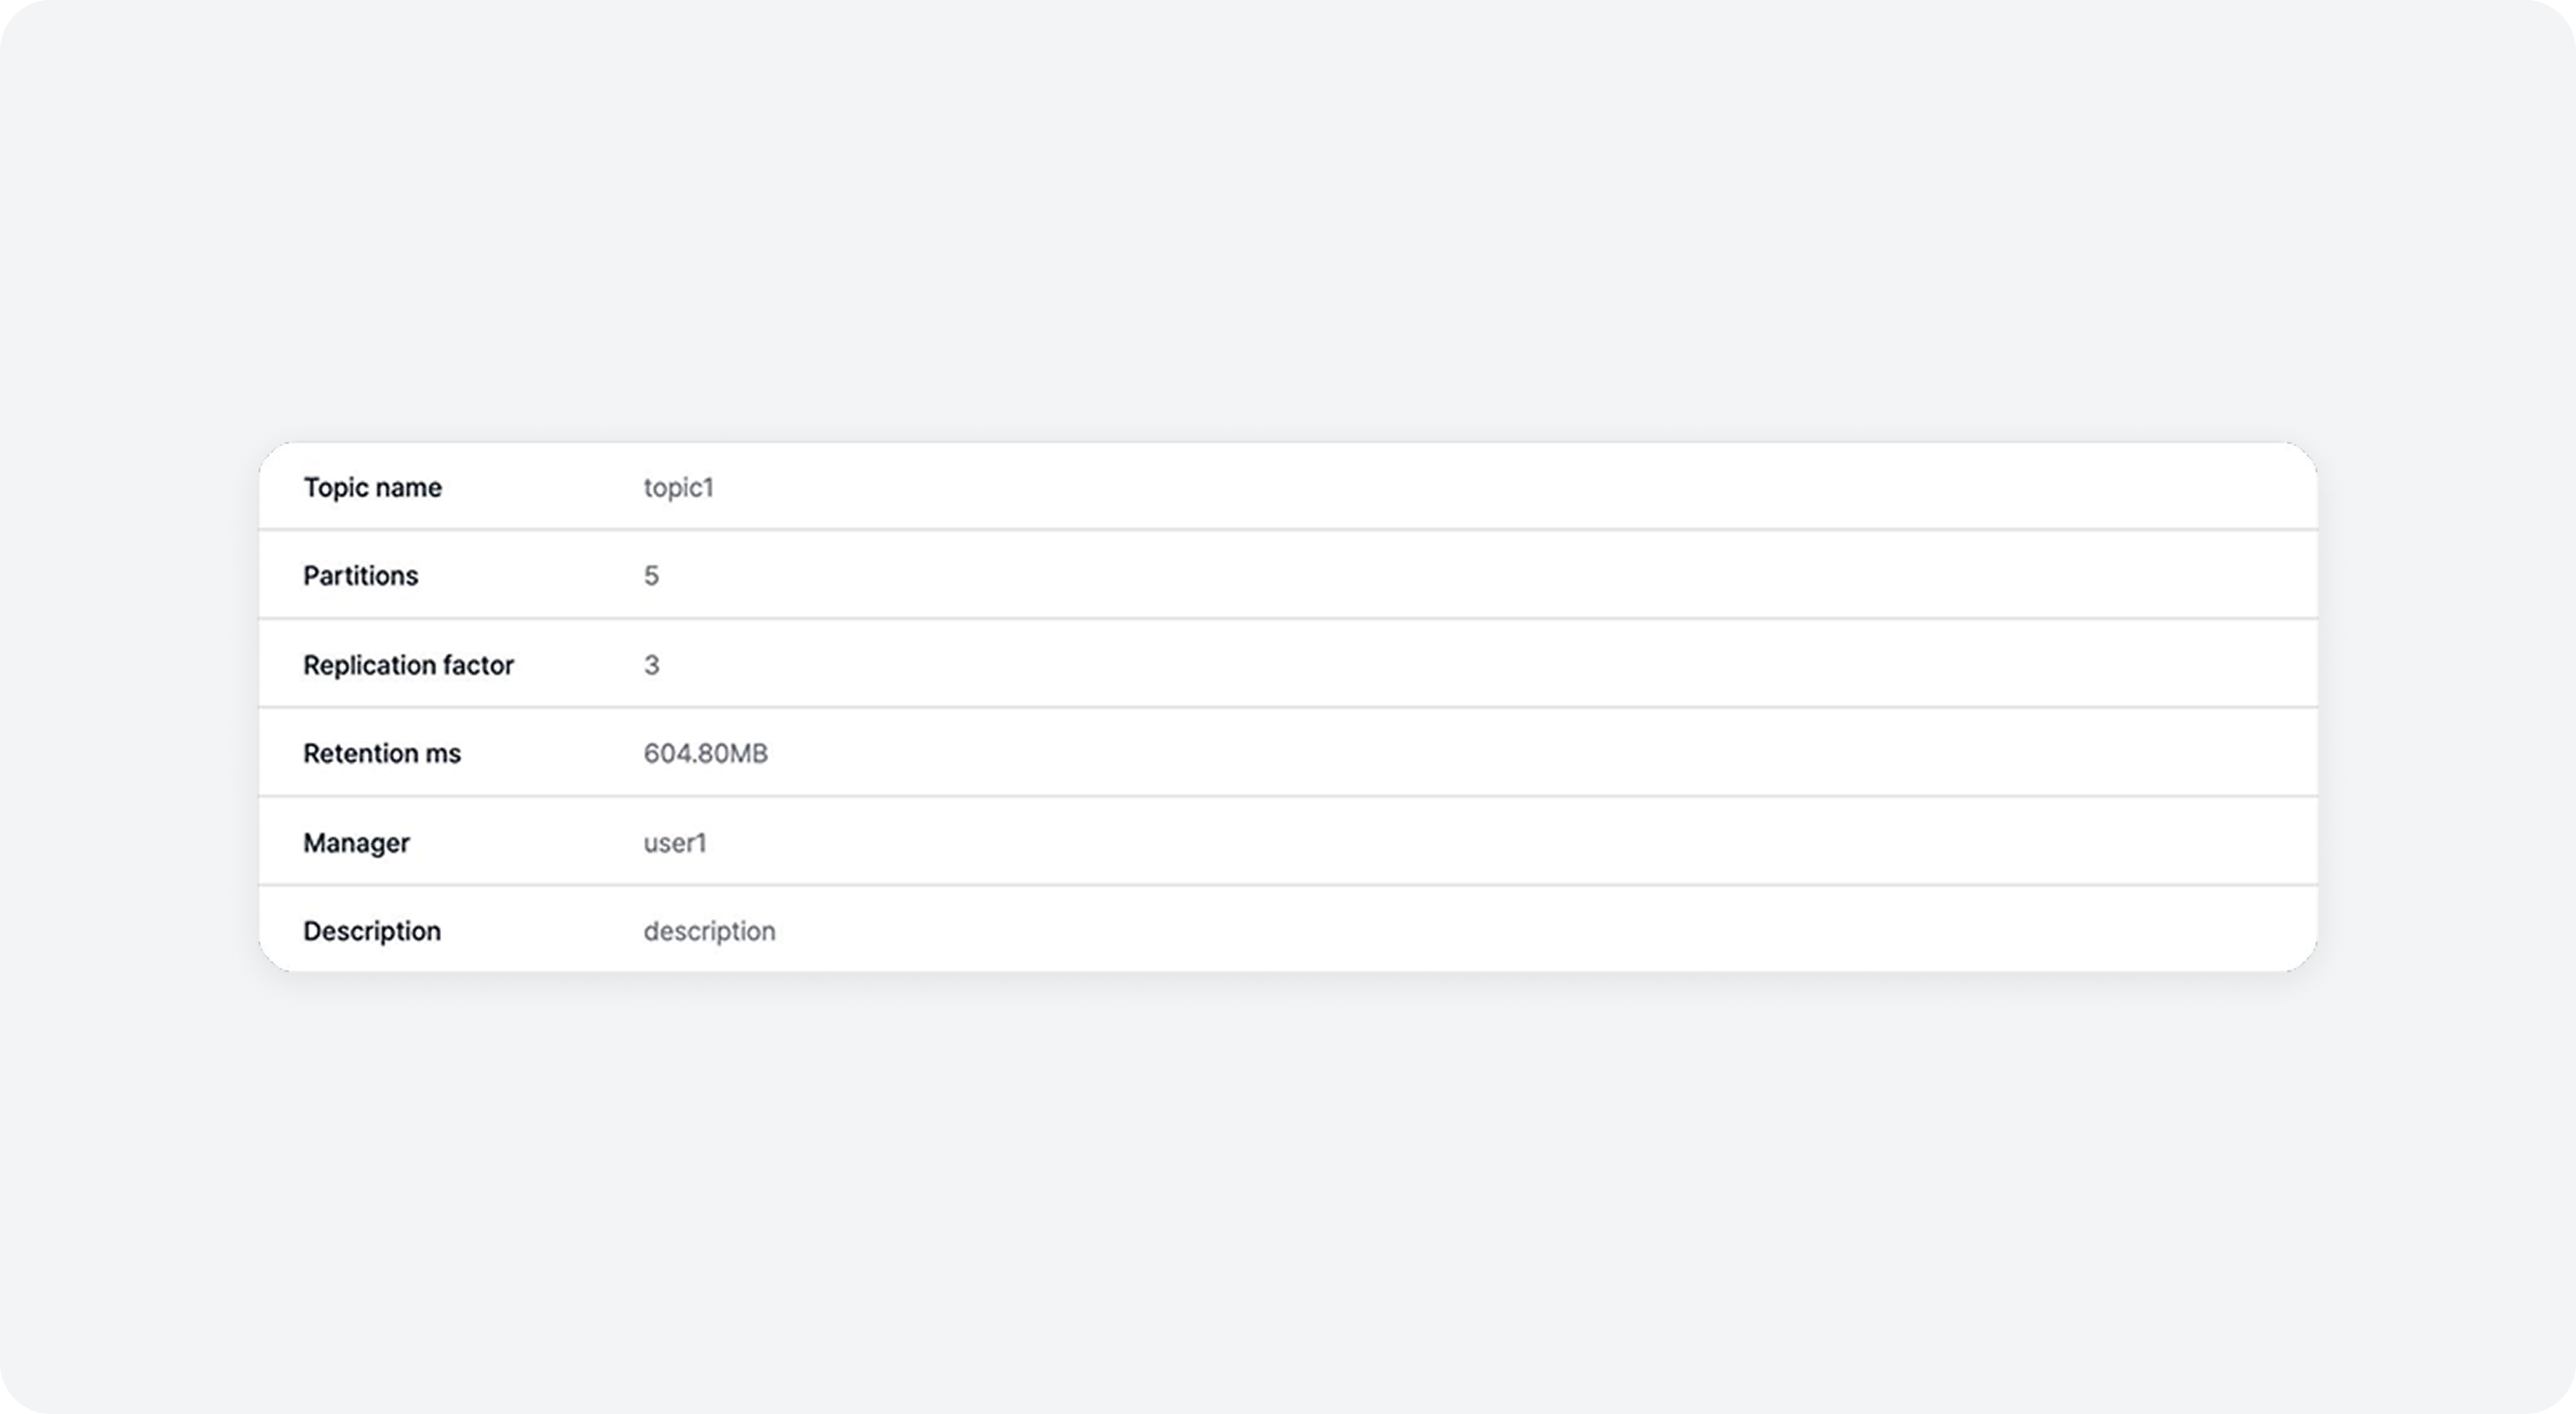
Topic Detail
You can compare with the previous month to view the following:
- Added topics
- Updated topics
- Deleted topics (topic name)
The following two can be viewed even without previous month data:
- Unused topics (topic name)
- Unused partitions per topic
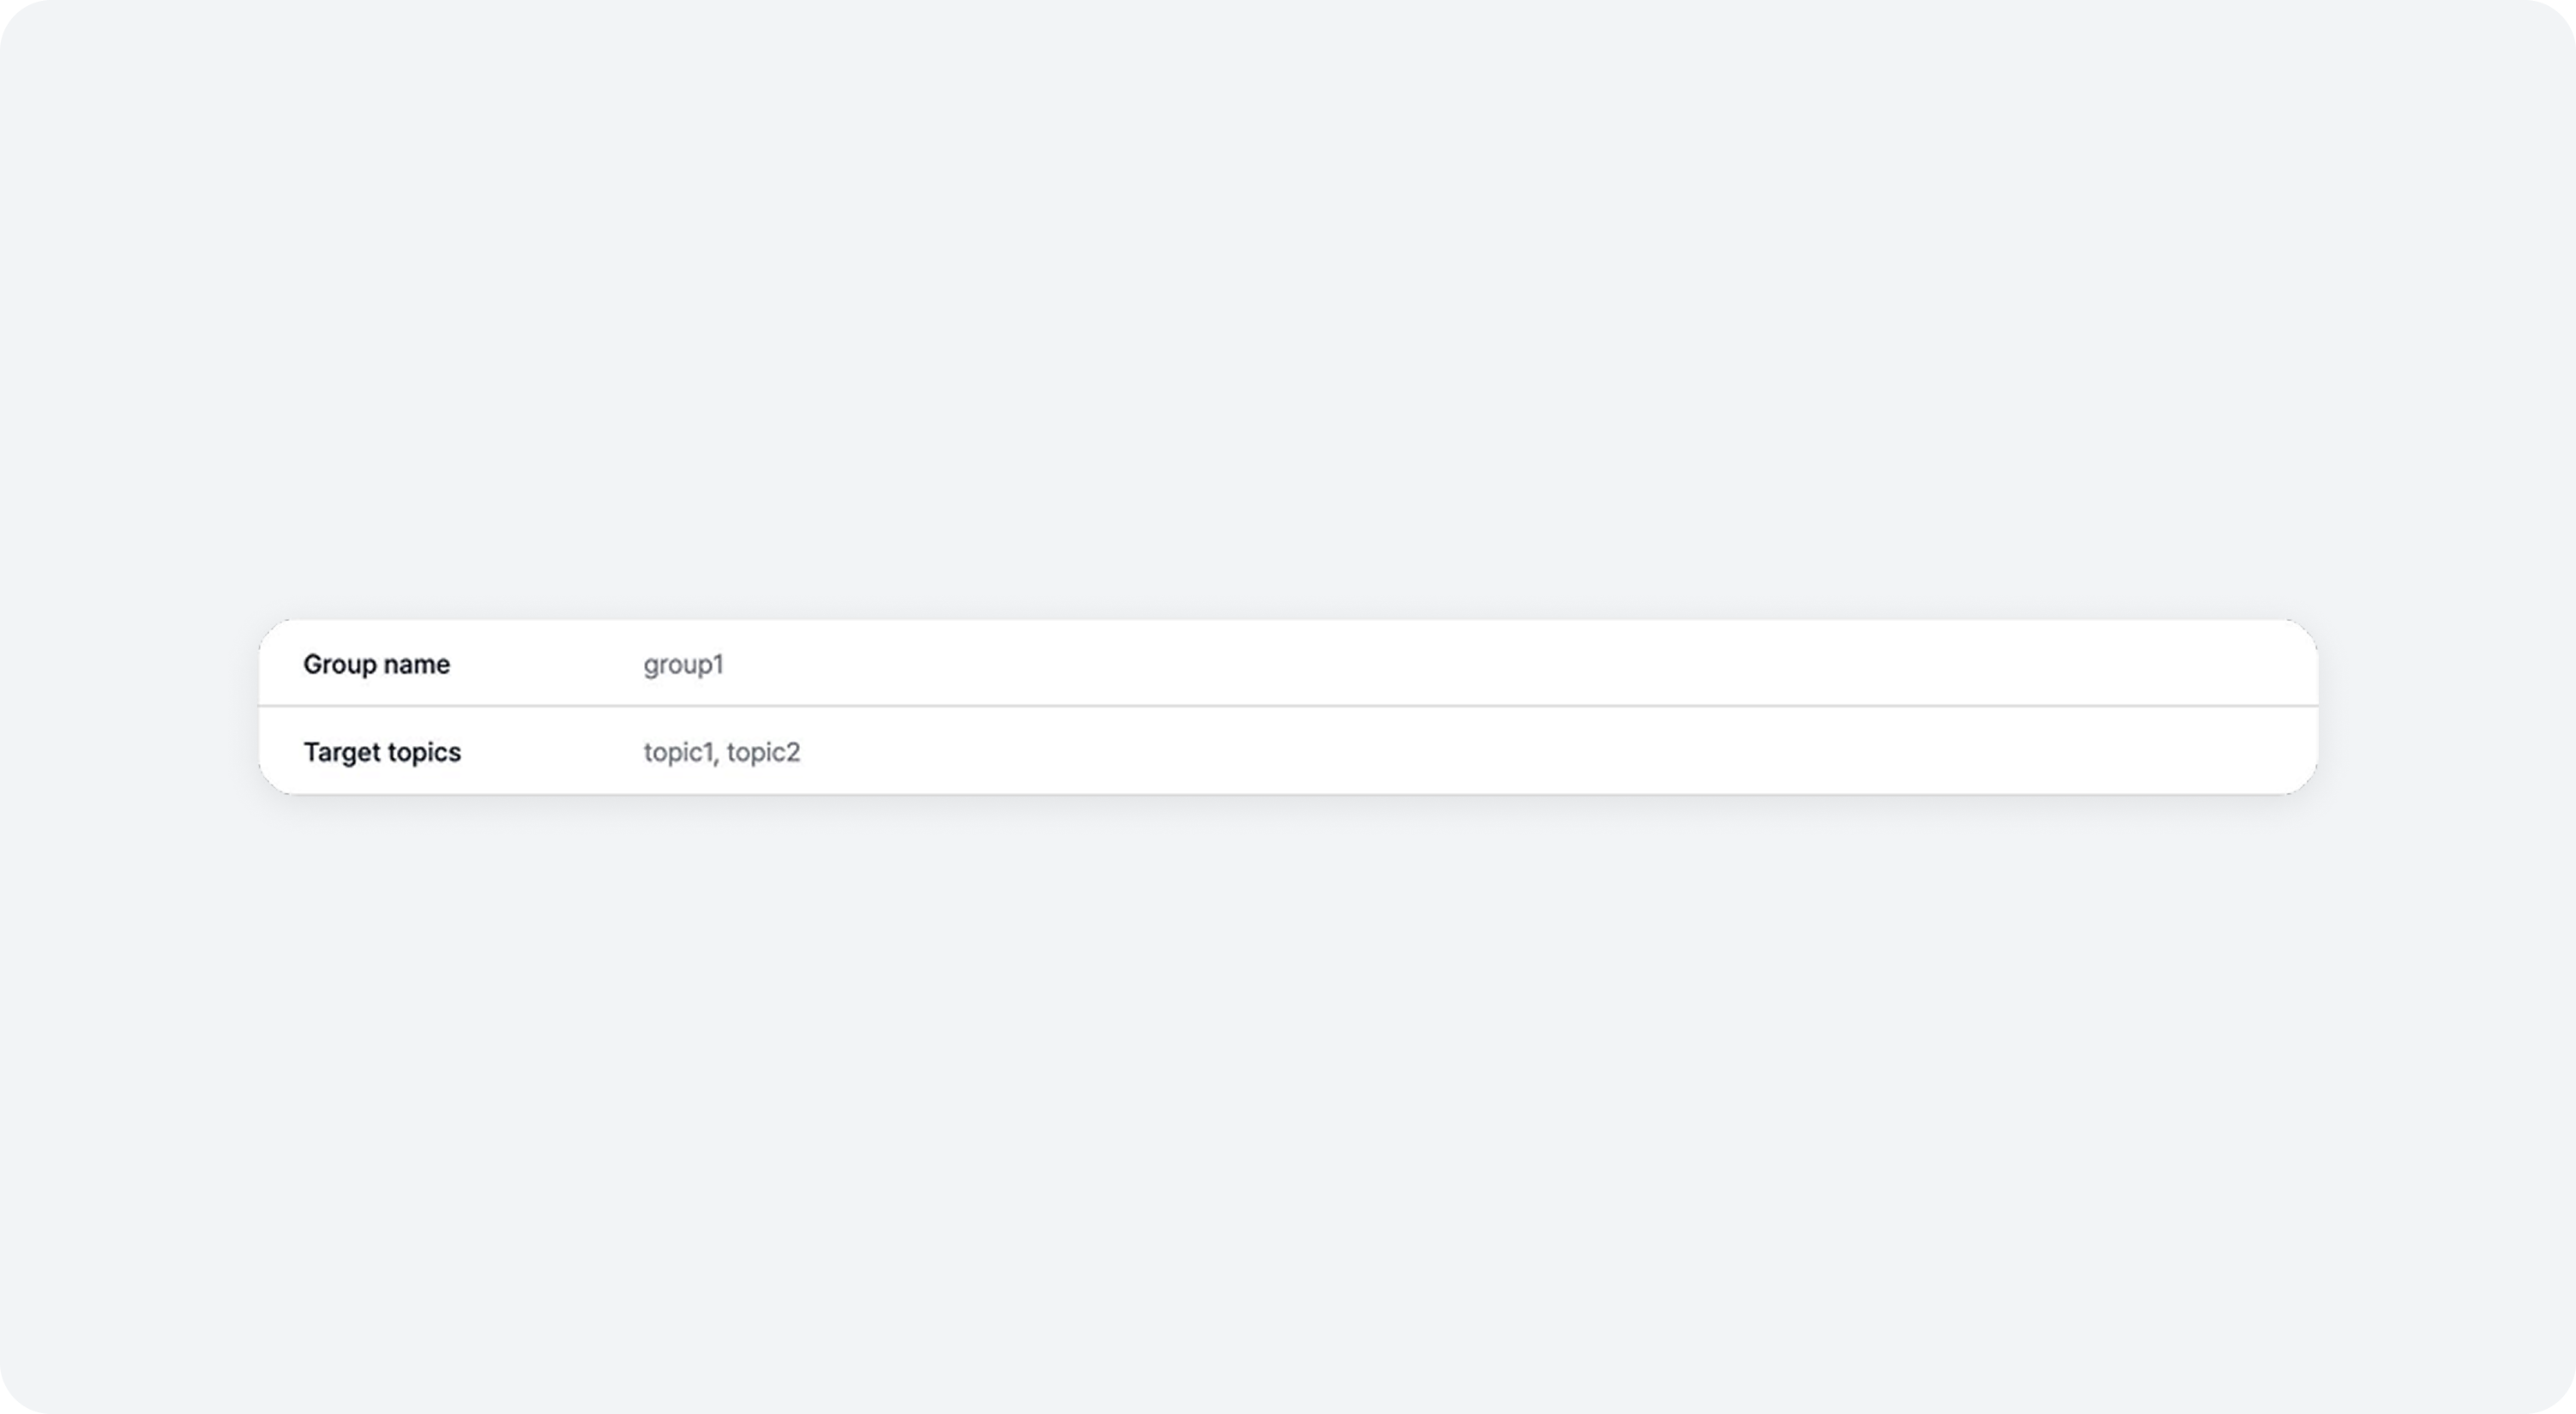
Consumer Group Detail
You can compare with the previous month to view the following:
- Added consumer groups
- Deleted consumer groups (consumer group name)
- Unused consumer groups (consumer group name)
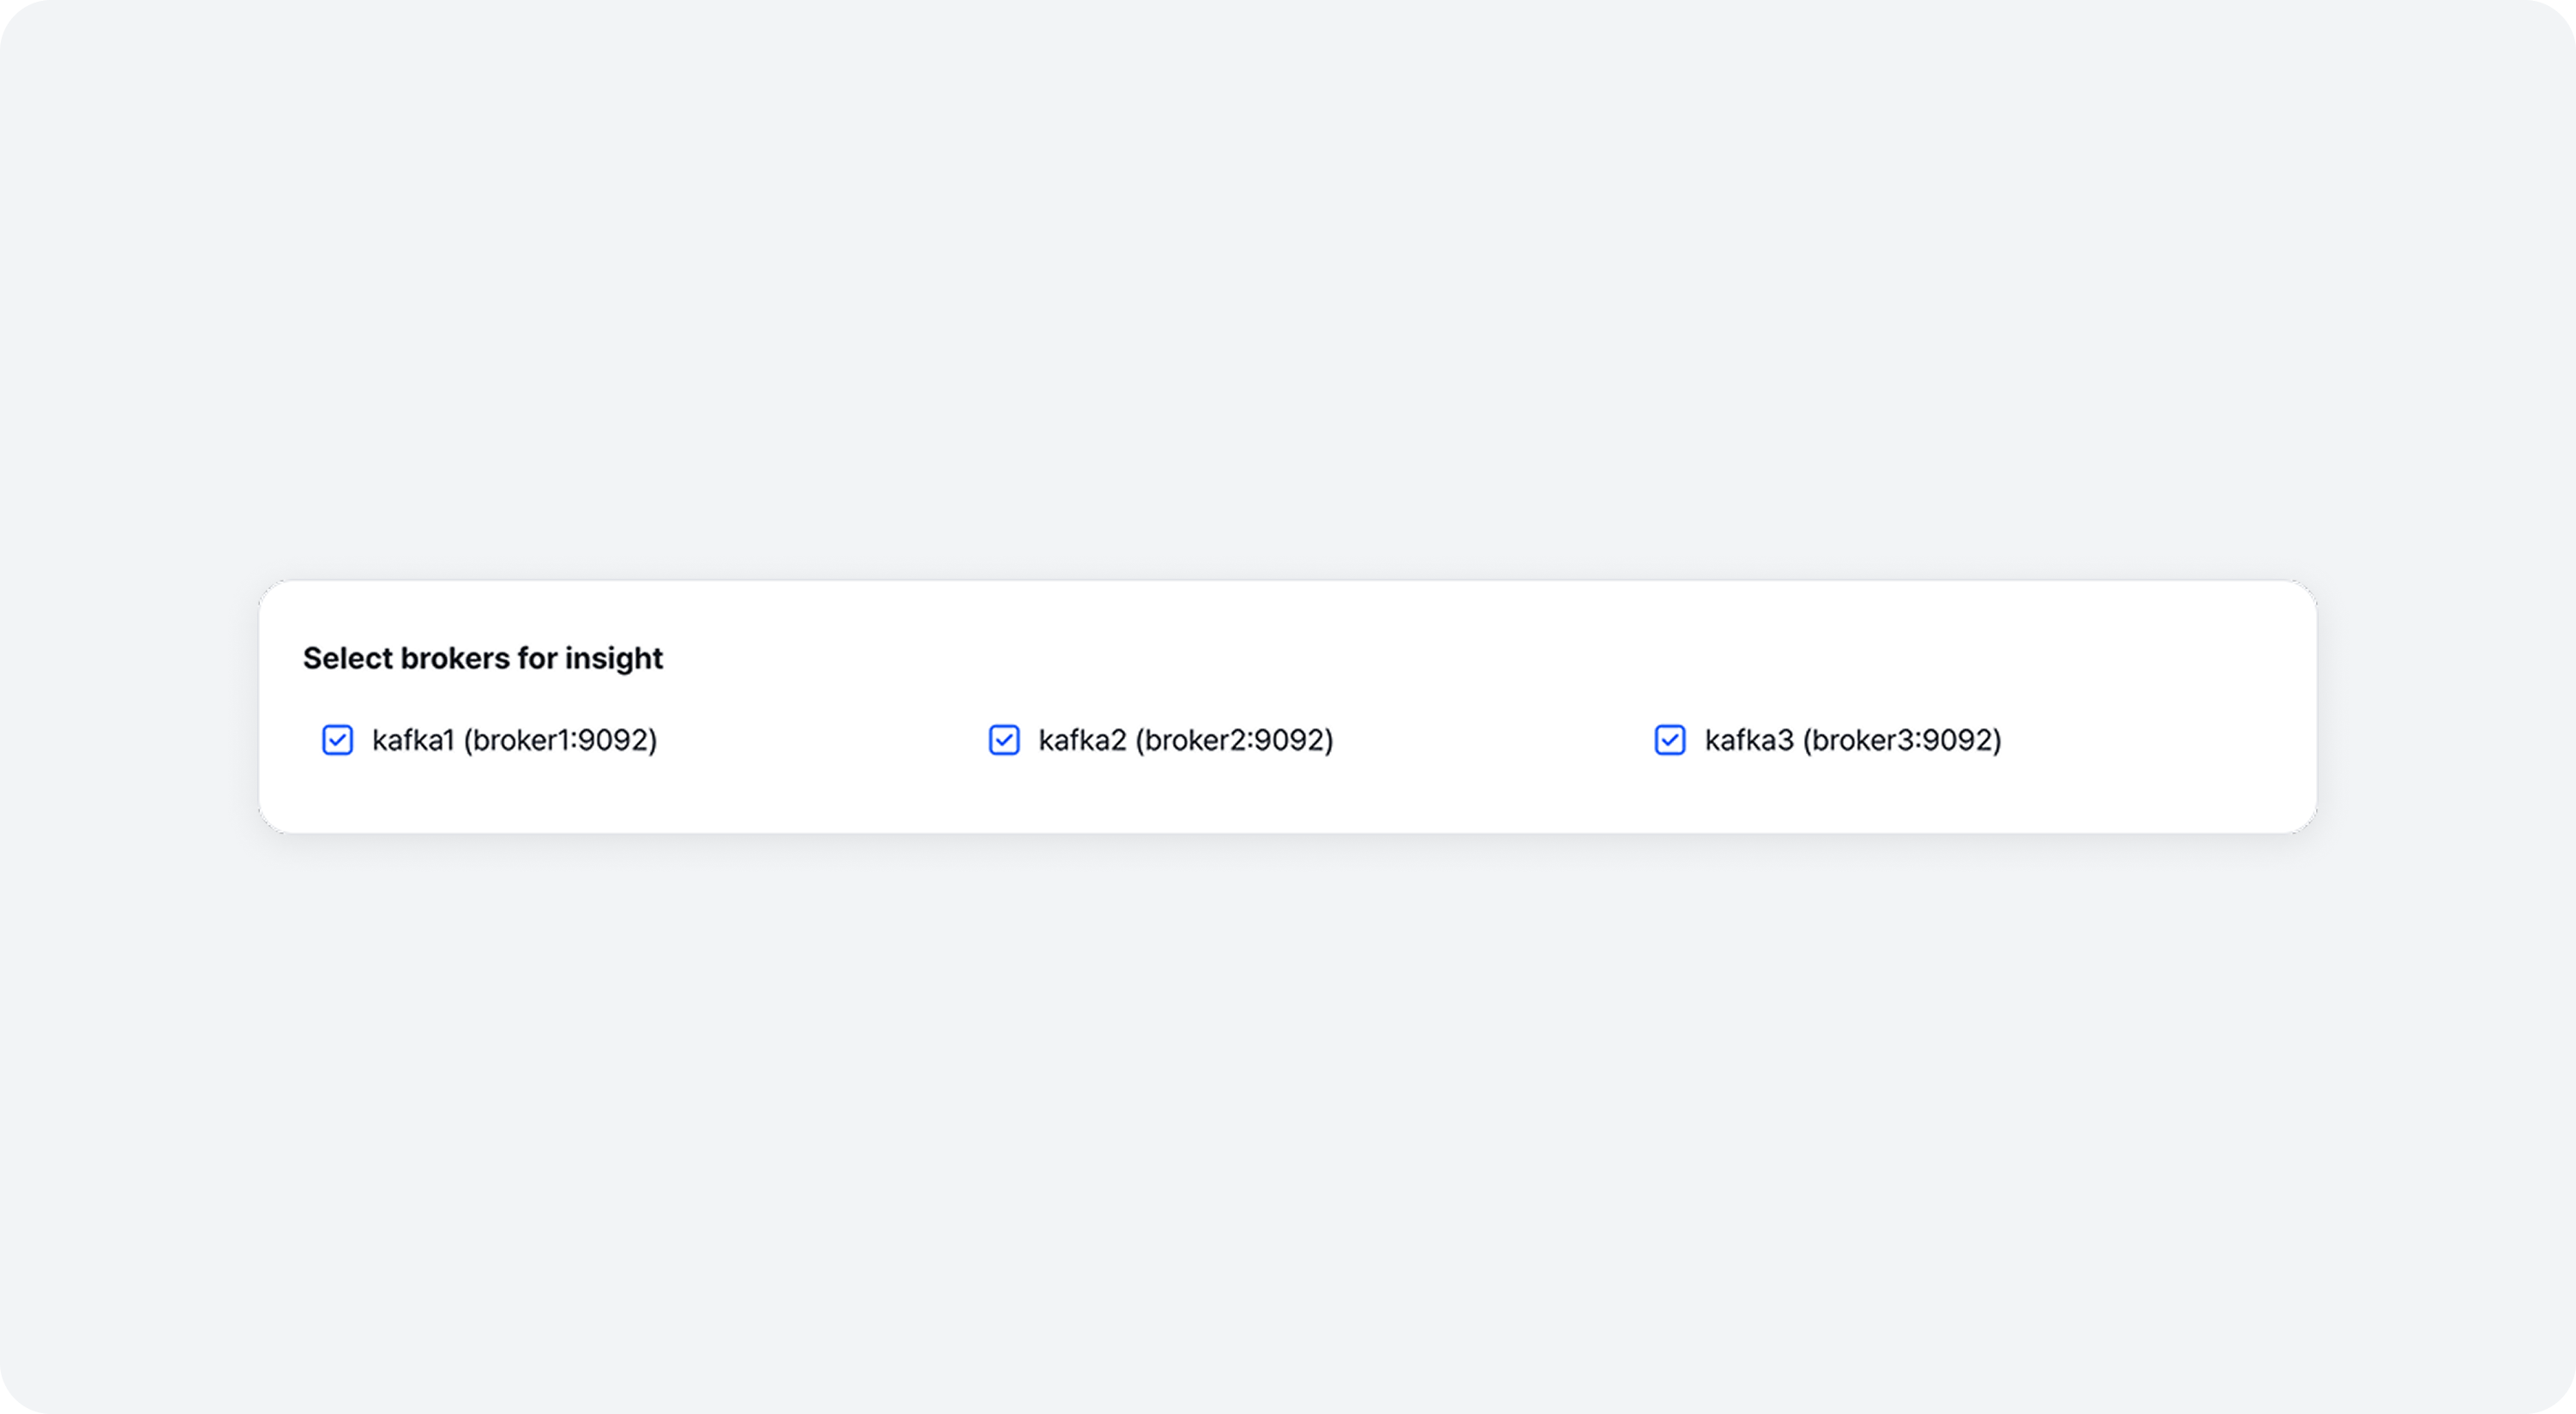
Broker Selection
You can select a broker to view the following three sections. If no broker is selected, data from all brokers will be shown.
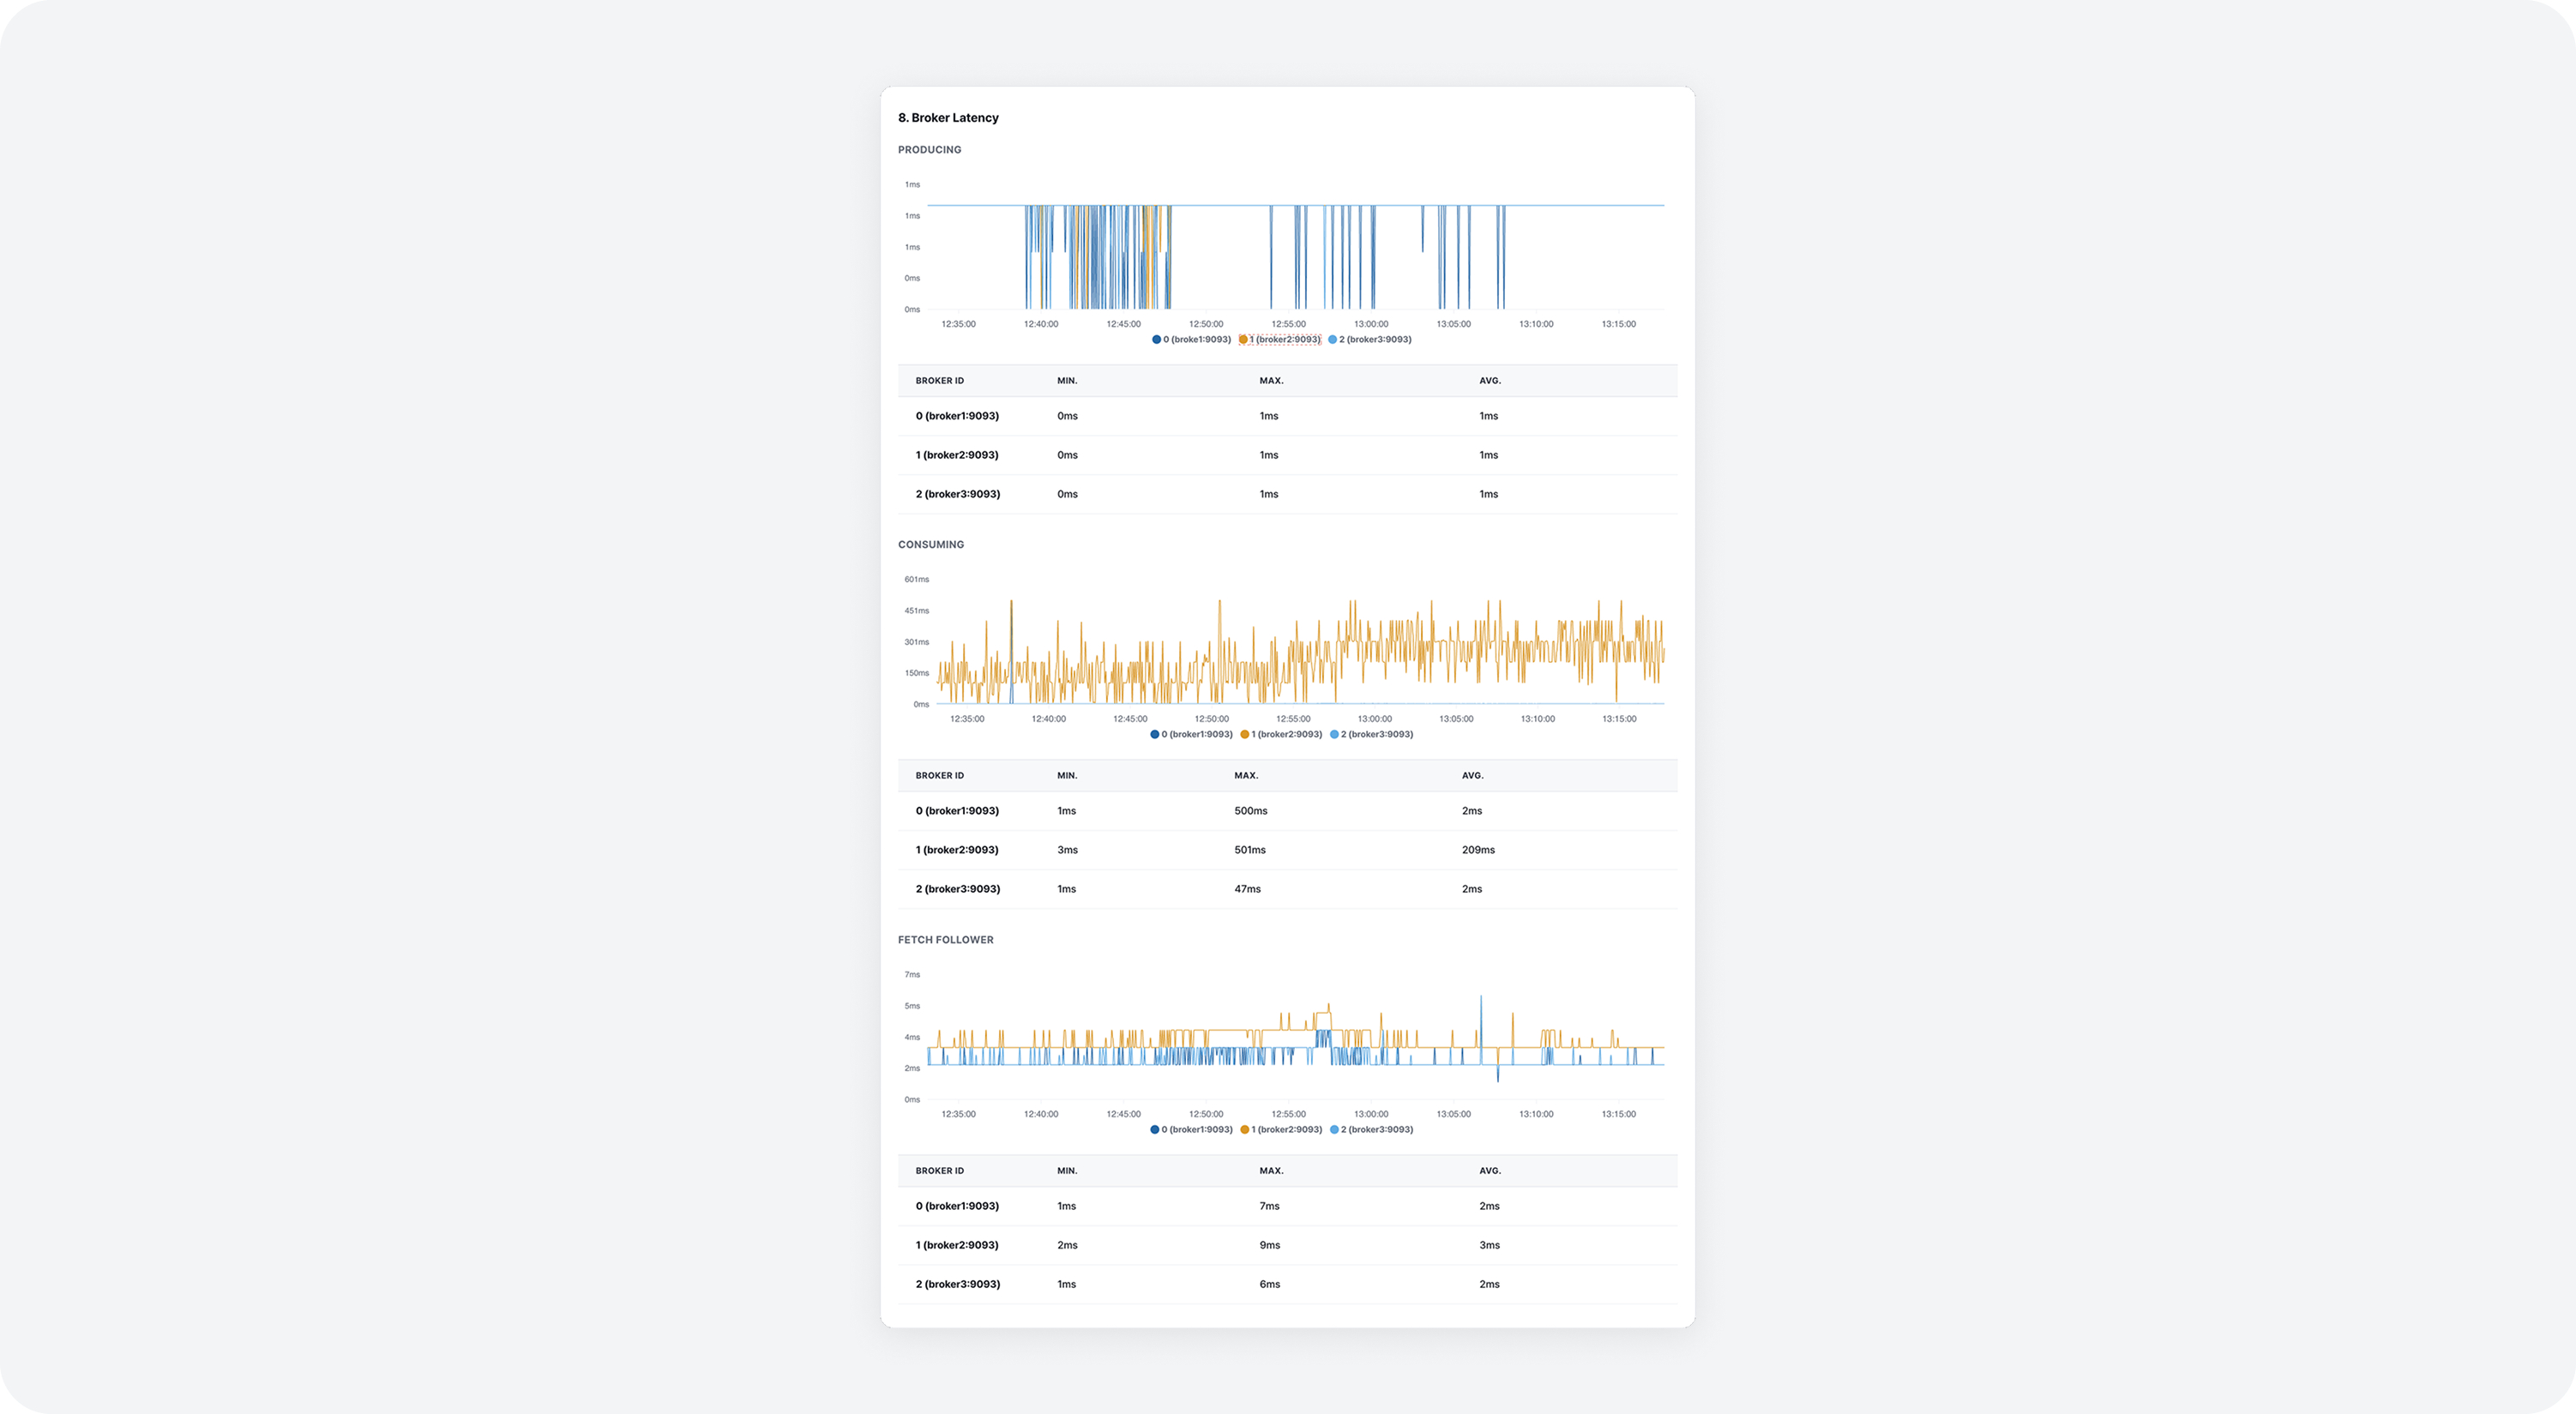
Broker Latency
View latency for the selected broker as a time series graph and table.
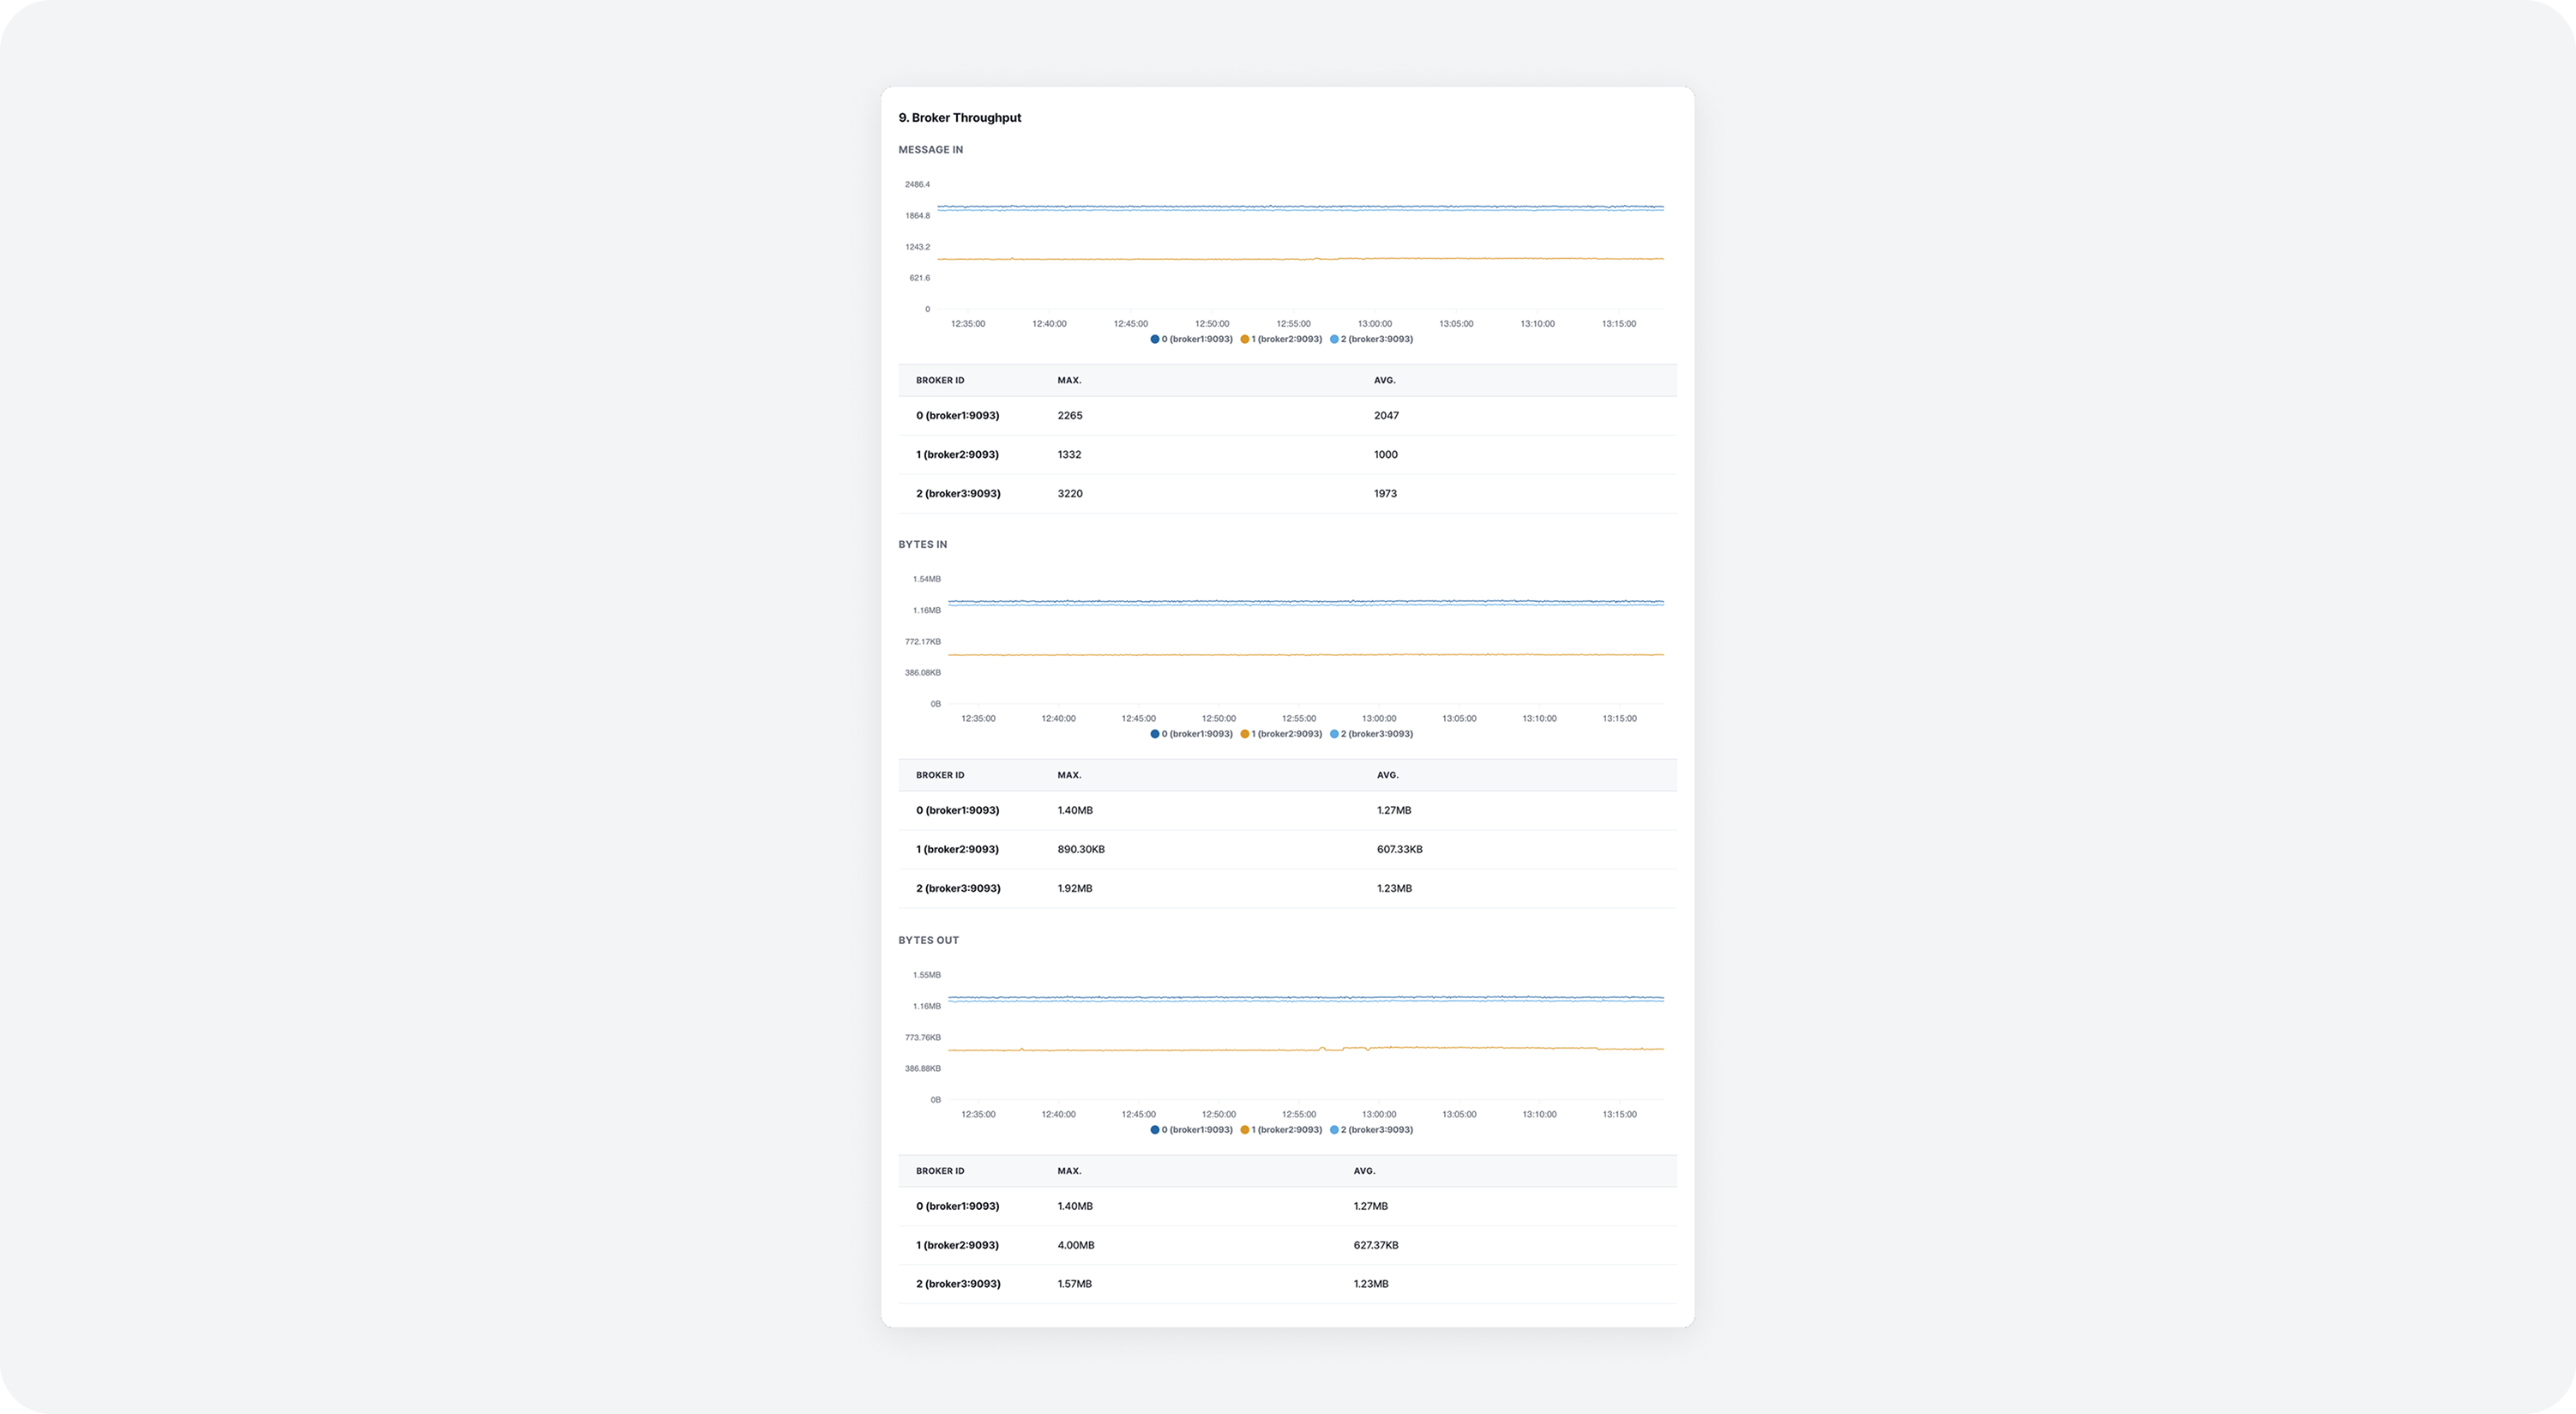
Broker Throughput
View throughput for the selected broker as a time series graph and table.
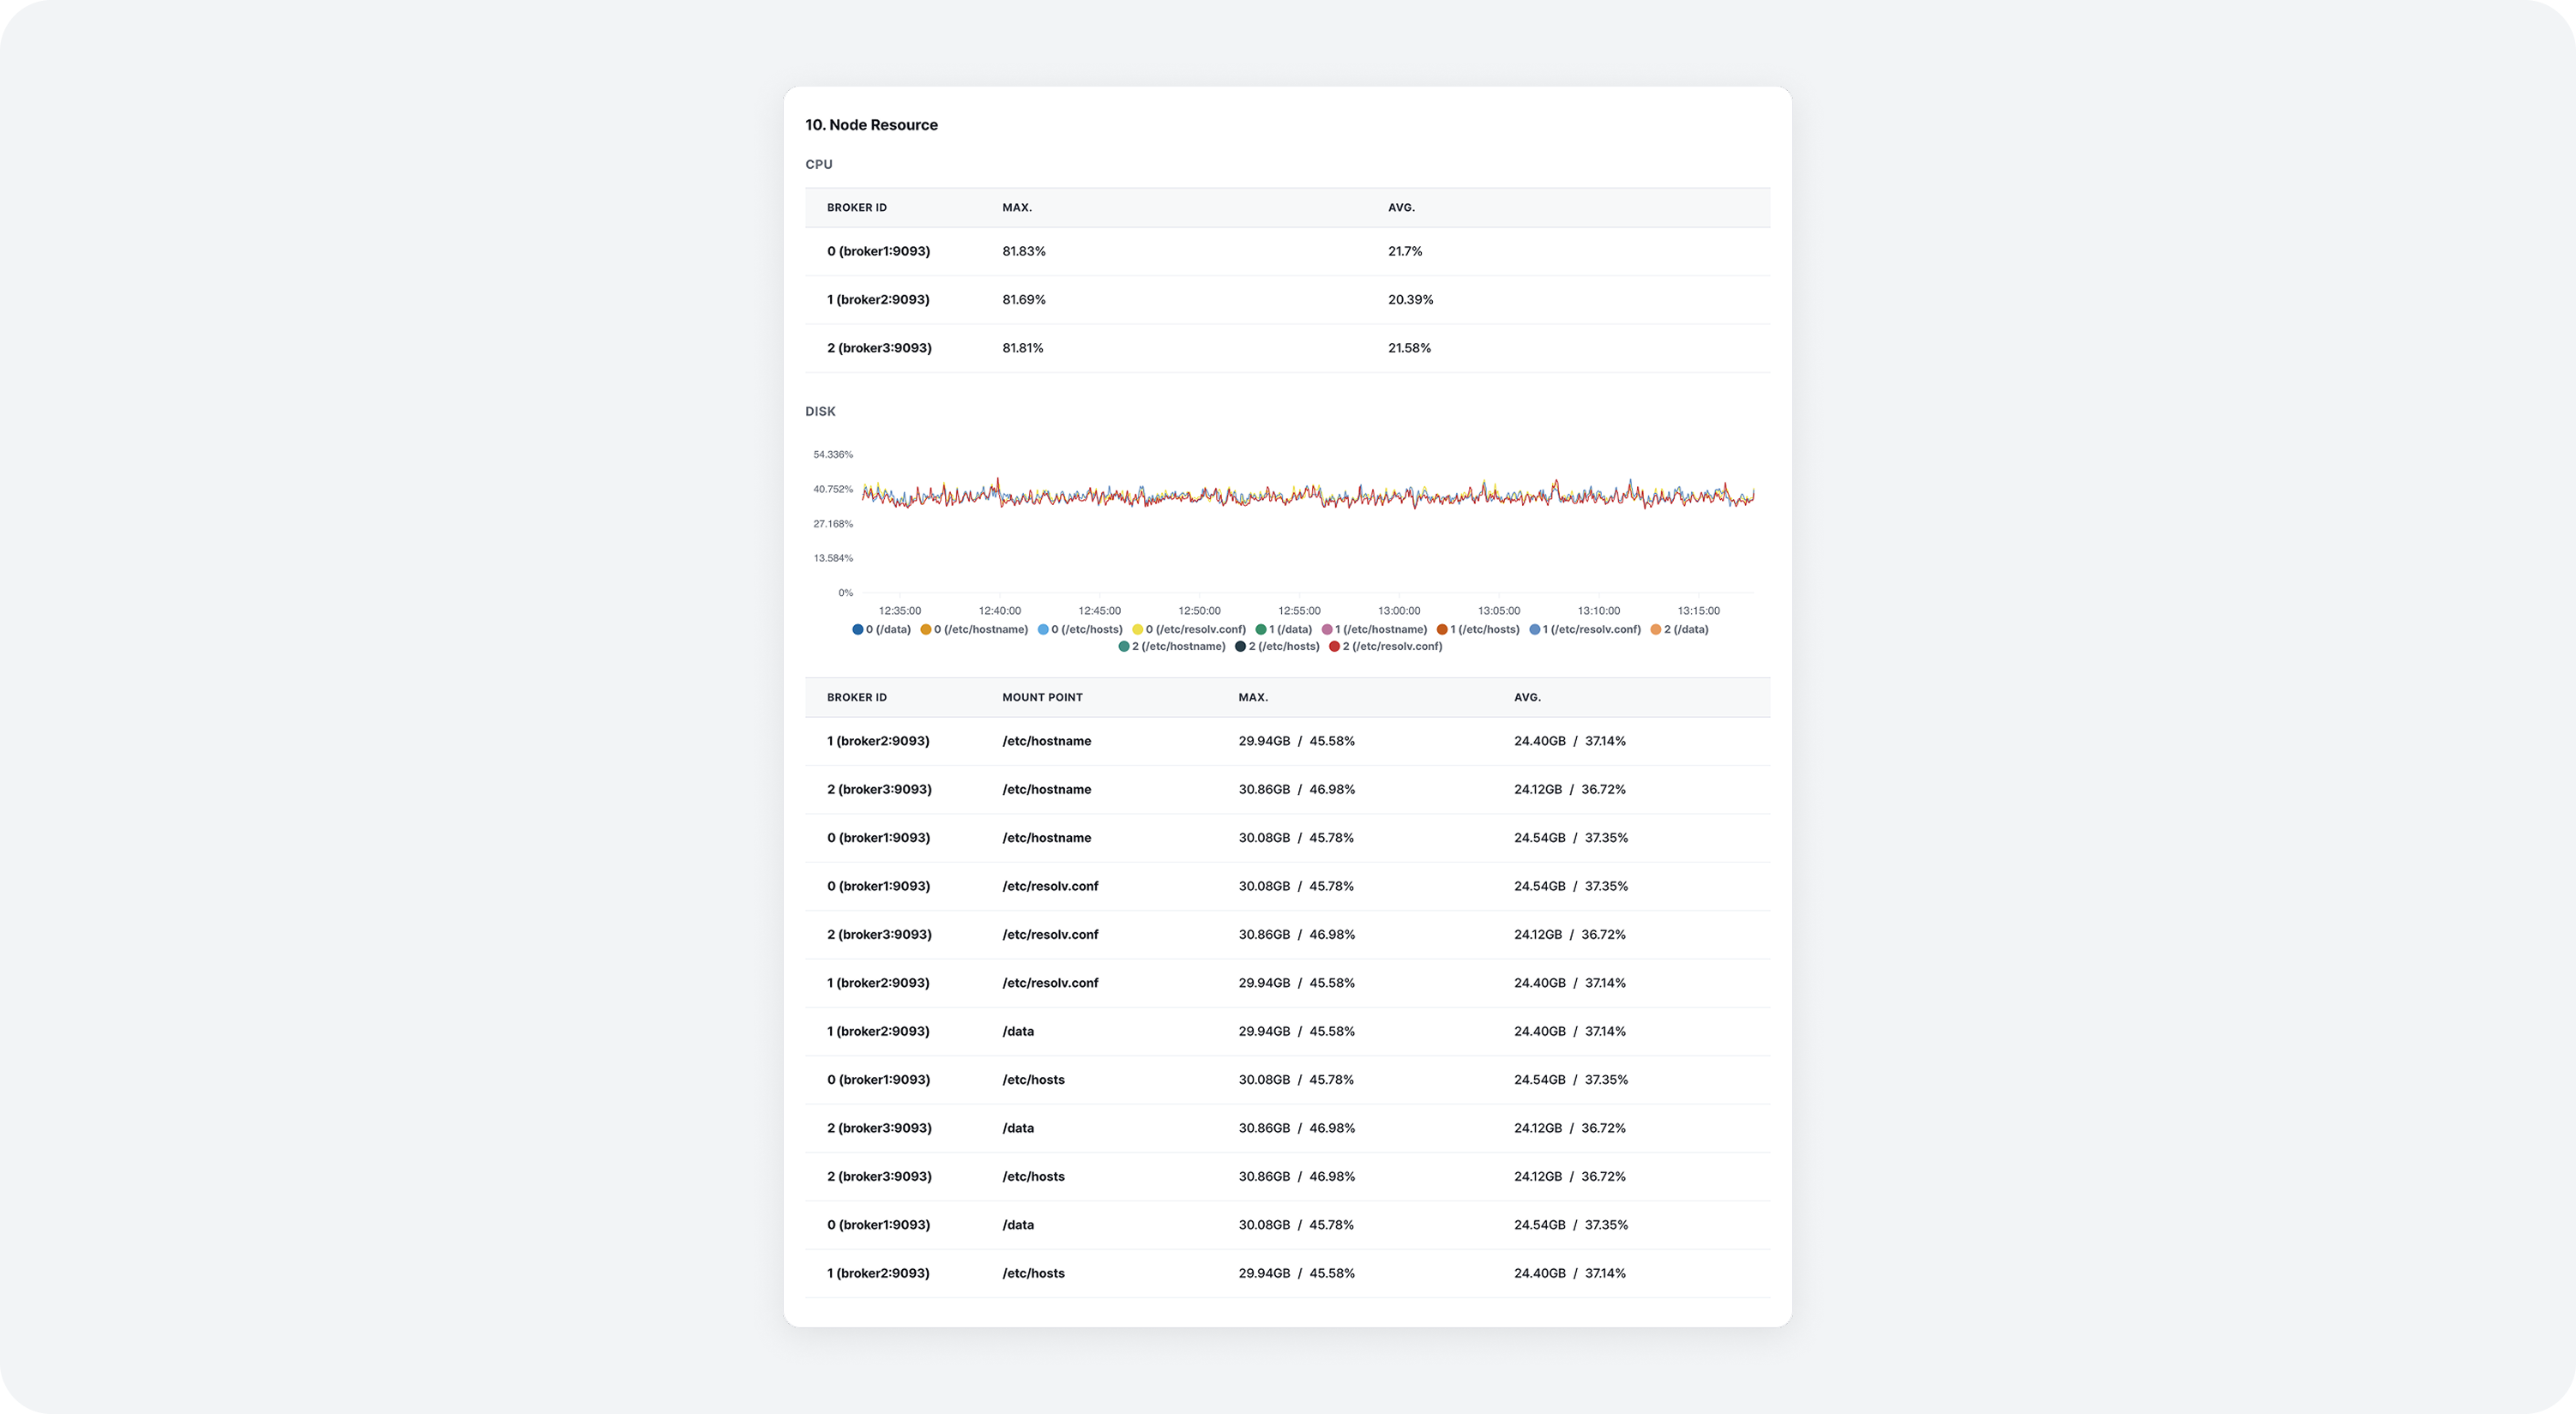
Node Resource
View node resource usage for the selected broker as a time series graph and table.